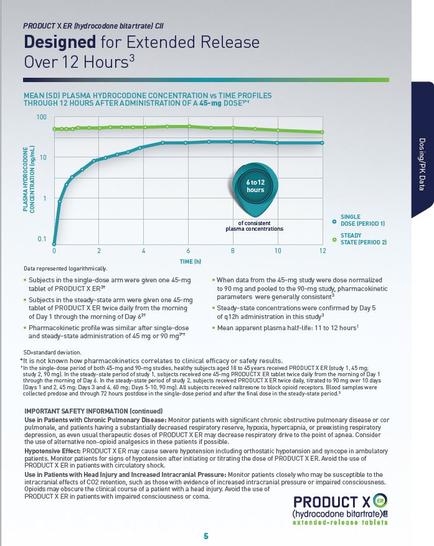
A line graph that shows the relationship between the product X and the extended release over 12 hours. The x-axis represents the time period while the y-axis shows the number of days of the week. The graph is divided into two sections. The top section is titled "Designed for Extended Release" and has a blue circle in the center. The blue circle has the product name "Product X" written in white text. Below the blue circle there is a text that reads "Over 12 Hours" and "Time Profiles". There are also two lines on the graph one in blue and one in green. The graph shows that the product has been designed for extended release with the blue line representing the time and the green line representing time. The lines show that the time has been steadily increasing over the past 12 hours with a slight decrease in the amount of time spent on the product. There is also a note on the right side of the graph that says "Important Safety Information (Continued)".
Description 
Type
Category
-
Date
2015
Collection
We encourage you to view the image in the context of its source document(s) and cite the source(s) when using these images. However, to cite just this image alone, click the “Cite This Image” button and then paste the copied text.