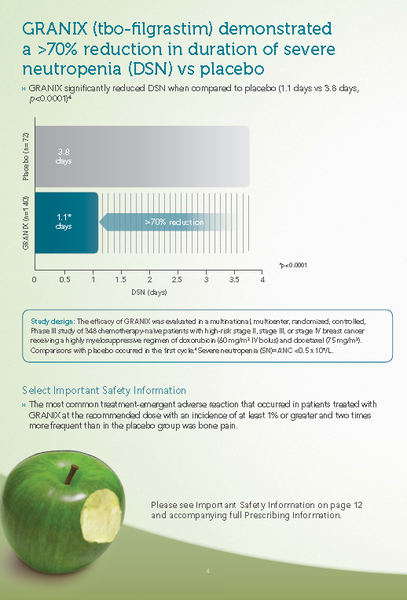
A slide from a presentation about Granix (tbo-filgrastim) demonstrated a 70% reduction in duration of severe neutropenia (DSN) vs placebo. The slide has a white background with a green apple on the left side. On the right side there is a bar graph that shows the percentage of patients who have been diagnosed with the virus. The graph is divided into two sections. The top section of the slide has the title "Granix" and the subtitle "70% reduction" in bold black font. Below the title there are two bullet points that explain the results of the graph. The first bullet point explains that Granix is significantly reduced when compared to placebo (1.1 days vs. 3.8 days). The second bullet point states that the virus has decreased in the number of patients treated with the same virus as the first one. The text below the graph explains that there are more important safety information about the virus such as "Please see Important Safety Information on page 12 and accompanying full Prescribing Information." Overall the slide is a visual representation of the data presented in the presentation.
Description 
Type
Category
-
Date
2013
Collection
We encourage you to view the image in the context of its source document(s) and cite the source(s) when using these images. However, to cite just this image alone, click the “Cite This Image” button and then paste the copied text.