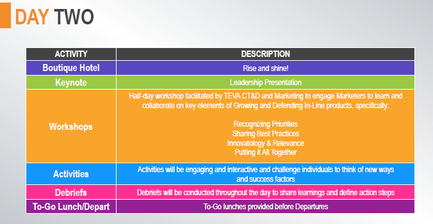
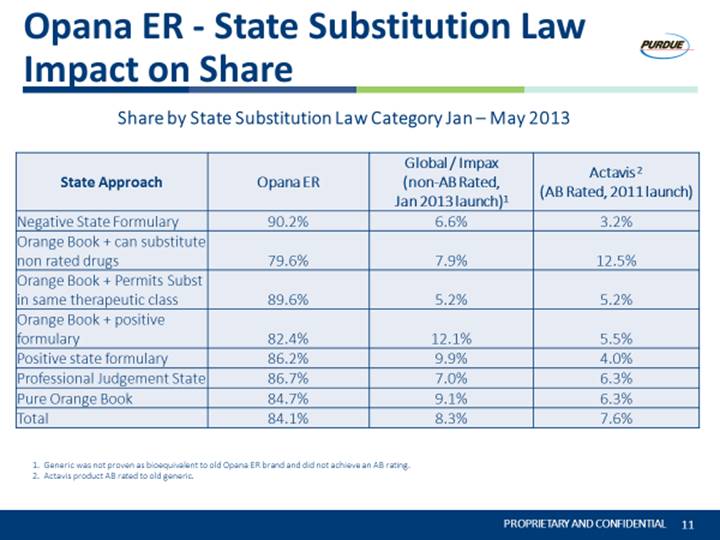
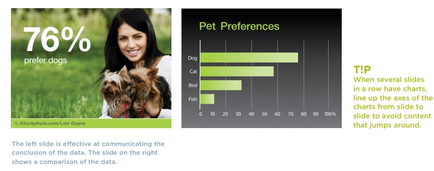
OIDA Image Collection
Filters:
Reset 
A slide from a presentation about pet preferences. On the left side of the slide there is a photo of a young woman with long dark hair and a big smile on her face holding a small dog in her arms. She is standing in a field of green grass. The slide is titled "76% prefer dogs" and has a title that reads "Pet Preferences". On the right side there are two graphs that show the percentage of pet preferences in a row. The first graph shows that the left slide is effective at communicating the conclusion of the data. The second graph shows a bar graph that shows that when several slides in rows have charts line up the axes of the charts from slide to slide to avoid content that jumps around.

Description Generated using AI

A slide from a presentation about pet preferences. On the left side of the slide there is a photo of a young woman with long dark hair and a big smile on her face holding a small dog in her arms. She is standing in a field of green grass. The slide is titled "76% prefer dogs" and has a title that reads "Pet Preferences". On the right side there are two graphs that show the percentage of pet preferences in a row. The first graph shows that the left slide is effective at communicating the conclusion of the data. The second graph shows a bar graph that shows that when several slides in rows have charts line up the axes of the charts from slide to slide to avoid content that jumps around.

We encourage you to view the image in the context of its source document(s) and cite the source(s) when using these images. However, to cite just this image alone, click the “Cite This Image” button and then paste the copied text.

Information copied to your clipboard:

"A slide from a presentation about pet preferences. On the left side of the slide there is a photo of a young woman with long dark hair and a big smil...