


Title
Description
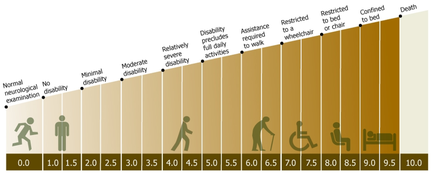
This chart quantifies the objective impairment resulting from neurological disabilities on a 10 point scale ranging from Normal neurological examination (0.0) to Death (10.0). No disability spans from 0.0 to 1.9 Minimal disability spans from 2.0 to 2.9 Moderate disability spans from 3.0 to 3.9 Relatively severe disability spans from 4.0 to 4.9 etc. Scores of 5.0 or above indicate a significant disability preventing one from engaging in one's usual activities without progressively greater assistance.
Type 
Category
-
Date
2016
Collection
We encourage you to view the image in the context of its source document(s) and cite the source(s) when using these images. However, to cite just this image alone, click the “Cite This Image” button and then paste the copied text.