


Title
Description
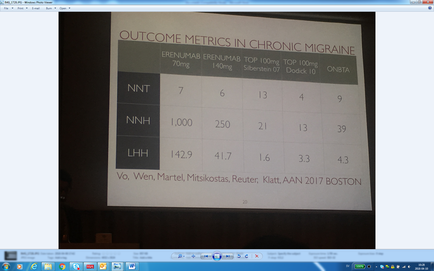
This is a table showing outcome metrics for treatment of chronic migraine by 3 different drugs (Erenumab 70mg Erenumab 140mg Topiramate 100mg OnabotulinumtoxinA). It includes averages for Number Needed to Treat (NNT) Number Needed to Harm (NNH) and Likelihood of being Helped or Harmed (LHH) for each drug. The trendlines suggest that either dose of Erenumab is far superior to Topiramate or OnabotulinumtoxinA in that Erenumab has a much higher NNH (up to 1000) and a much higher LHH (up to 142.9) both of which are desirable.
Type
Category
Source 1 of 2
-
Date
2018
Collection
-
Date
2018
Collection
We encourage you to view the image in the context of its source document(s) and cite the source(s) when using these images. However, to cite just this image alone, click the “Cite This Image” button and then paste the copied text.