


Title
Description
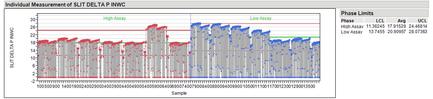
This is a chart showing phase limits for two samples of SLIT DELTA P INWC.
Type 
Category
-
Date
2014
Collection
We encourage you to view the image in the context of its source document(s) and cite the source(s) when using these images. However, to cite just this image alone, click the “Cite This Image” button and then paste the copied text.