


Title
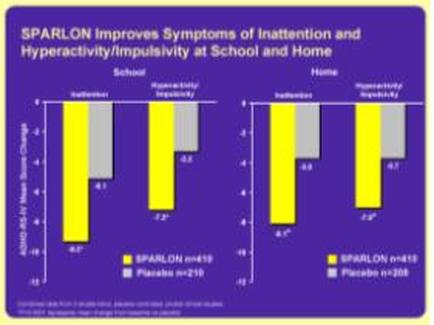
Sparlon improves symptoms of inattention and hyperactivity/impulsivity at school and home
Description
This is two bar charts showing the effect of treatment with Sparlon on ADHD patients between the ages of 6 and 17 (presumably). Both bar charts compare performance by Sparlon vs. a placebo in treating inattention & hyperactivity/impulsivity (listed separately on the x-axis) as measured by changes in the ADHD Rating Scale-IV (on the y-axis on a range of 0 to -12 where lower scores are preferable). The data shows that Sparlon outperforms the placebo for both metrics in both locations (School & Home) by a factor of roughly 2 to 1 (ex : Sparlon scores -11 on the ADHD-RS-IV for inattention at school with the Placebo scoring -5.5 for same).
Type 
Category
Source 1 of 2
-
Date
2010
Collection
-
Date
2010
Collection
We encourage you to view the image in the context of its source document(s) and cite the source(s) when using these images. However, to cite just this image alone, click the “Cite This Image” button and then paste the copied text.