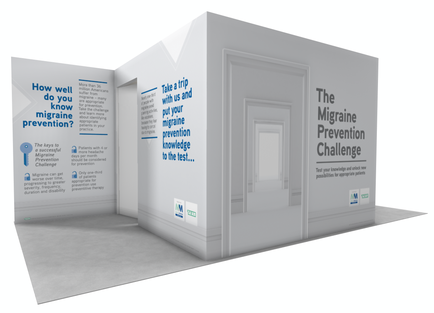
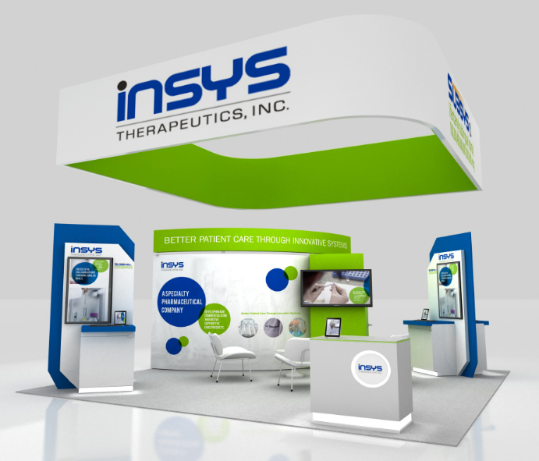
A 3D rendering of a trade show booth for Insys Therapeutics Inc. The booth is white with a green and blue color scheme. The company's logo is prominently displayed on the top of the booth which is a blue and white banner with the company's name in blue letters. Below the logo there is a banner that reads "Better patient care through innovative technology". 
The booth is divided into two sections with the left section on the left side and the right section in the middle. The left section has a large screen on the wall displaying information about the company and its services. The right section has two smaller screens on the right side displaying the same company's products.
There are two white chairs in front of the screens and a desk with a computer monitor on it. The floor is covered with a gray carpet and the background is white. The overall design is modern and professional with a clean and modern look.
 
                                            Category
- 
                                                                        
                                                                                                            Date 2014 Collection 
We encourage you to view the image in the context of its source document(s) and cite the source(s) when using these images. However, to cite just this image alone, click the “Cite This Image” button and then paste the copied text.


                        ![An infographic that explains the benefits of full therapeutic value for patients like Patrick. It has a blue background with white text and an illustration of Patrick in the center. The illustration is of a man with his arms crossed and a serious expression on his face. <br /><br />On the left side of the image there is a line graph that shows hours on the x-axis and the pain plasma hydromorphone level on the y-axis demonstrating that "Exalgo remained above 50% of C[?] for more than 90% of dosing interval" as compared to hydromorphone.  <br /><br />The right side of the graphic has recommended instructions on how best to treat a patient like Patrick with Exalgo and also has important risk information for Exalgo.](https://oida-resources-images.azureedge.net/public/full/3d05d7df-6b4f-46b4-a36b-ee5f924ecb77.png) 
                         
                         
                        