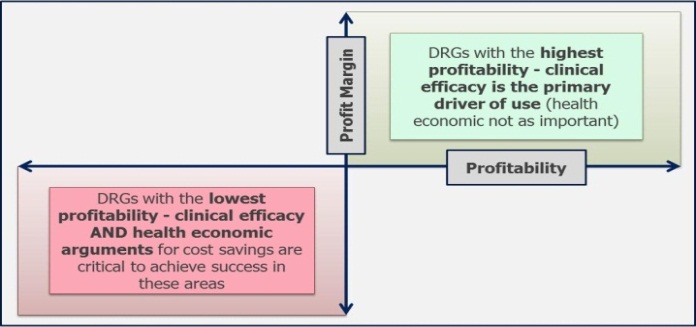
A flowchart that shows the relationship between DRGs and profitability. The flowchart is divided into two sections.
The first section is labeled "DRGs with the highest profitability - clinical efficacy - the primary driver of use (health economic not as important)". The second section is titled "Profit Margin" and is labeled as "Profitability".
There are two arrows connecting the two sections one on the left side of the flowchart and the other on the right side. The first arrow is pointing towards the bottom left corner of the image indicating that DRGs are the lowest profitability and health economic arguments for cost savings are critical to achieve success in these areas. The second arrow is towards the top right corner indicating a higher profitability and a lower profitability.
Source 1 of 3
-
Date
2013
Collection
-
Date
2013
Collection
-
Date
2013
Collection
We encourage you to view the image in the context of its source document(s) and cite the source(s) when using these images. However, to cite just this image alone, click the “Cite This Image” button and then paste the copied text.
