


Title
Description
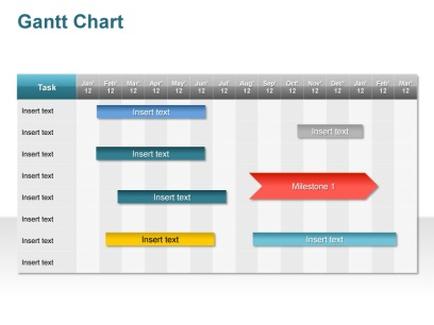
This is a blank template for a Gantt chart a type of bar chart that illustrates a project schedule. There are 8 lines for projects spanning 15 months (from January 2012 to March 2013). There are also 7 text boxes in 6 different colors which say either Insert text (6) or Milestone (1).
Type 
Category
Source 1 of 4
-
Date
2014
Collection
-
Date
2016
Collection
-
Date
2014
Collection
-
Date
2014
Collection
We encourage you to view the image in the context of its source document(s) and cite the source(s) when using these images. However, to cite just this image alone, click the “Cite This Image” button and then paste the copied text.