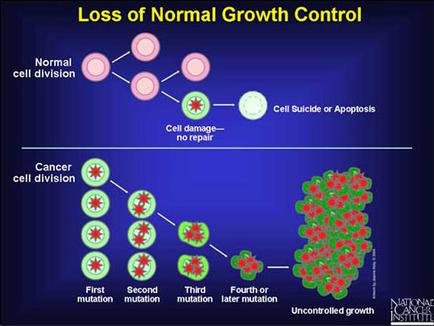
OIDA Image Collection
Filters:
Reset 
A diagram that shows the loss of normal growth control in cancer cells. It is divided into two sections. The top section is titled "Loss of Normal Growth Control" and it shows a normal cell division which is a type of cancer cell division. The normal cell is represented by a pink circle with a red dot in the center representing the cell damage or proptosis. The cell damage is caused by a cell that is damaged or repaired which causes the cell to repair and damage the cell. The second section is labeled "Cancer cell division" and shows the first and second mutation of the cancer cell which occurs when the cell is infected with cancer. The third section is labelled "Third mutation" and represents the fourth or fifth mutation. The fourth section is highlighted in red indicating that the cell has been infected with the disease. The fifth section is colored in green representing cancer cells and the sixth section is color-coded to show the different stages of the disease such as the first mutation second mutation third mutation and fourth mutation. At the bottom of the image there is a text that reads "Uncontrolled growth" and a logo for the National Cancer Institute.

Description Generated using AI

A diagram that shows the loss of normal growth control in cancer cells. It is divided into two sections. The top section is titled "Loss of Normal Growth Control" and it shows a normal cell division which is a type of cancer cell division. The normal cell is represented by a pink circle with a red dot in the center representing the cell damage or proptosis. The cell damage is caused by a cell that is damaged or repaired which causes the cell to repair and damage the cell. The second section is labeled "Cancer cell division" and shows the first and second mutation of the cancer cell which occurs when the cell is infected with cancer. The third section is labelled "Third mutation" and represents the fourth or fifth mutation. The fourth section is highlighted in red indicating that the cell has been infected with the disease. The fifth section is colored in green representing cancer cells and the sixth section is color-coded to show the different stages of the disease such as the first mutation second mutation third mutation and fourth mutation. At the bottom of the image there is a text that reads "Uncontrolled growth" and a logo for the National Cancer Institute.

We encourage you to view the image in the context of its source document(s) and cite the source(s) when using these images. However, to cite just this image alone, click the “Cite This Image” button and then paste the copied text.

Information copied to your clipboard:

"A diagram that shows the loss of normal growth control in cancer cells. It is divided into two sections. The top section is titled "Loss of Norm...