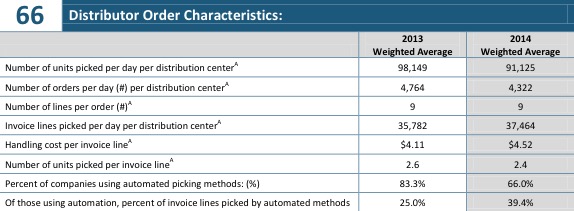
A table that shows the distribution order characteristics of a company. The table is divided into two columns one for the number of units picked per day per distribution center and the other for the weighted average.
The table has three rows each representing a different type of distribution center. The first row shows the total number of orders per day the second row shows that the company has a weighted average of 91125 and the third row shows how the company is weighing the average.
In the first row the table shows that in 2013 the number has been picked up per day for the distribution center with the highest number being in 2013 and the lowest being in 2014. The highest number is in 2014 with a weight of 91.125. The lowest number is at the top of the table with an average weight of 4764. The average weight is at 9322. The numbers in the second column show that the number in the third column is in the fourth column while the numbers in fifth column are in the sixth column. The third column shows the percentage of companies using automated picking methods (% of those using automation percent of invoice lines picked by automated methods).
Overall the image shows that a company has the highest distribution order in 2013 compared to the weighted averages in 2014 and 2014.
Category
Source 1 of 4
-
Date
2016
Collection
-
Date
2016
Collection
-
Date
2016
Collection
-
Date
2016
Collection
We encourage you to view the image in the context of its source document(s) and cite the source(s) when using these images. However, to cite just this image alone, click the “Cite This Image” button and then paste the copied text.