


Title
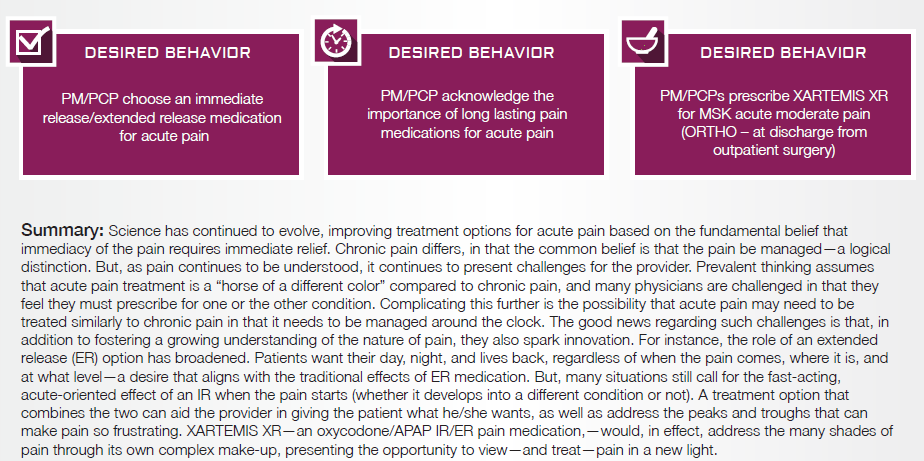
Description 
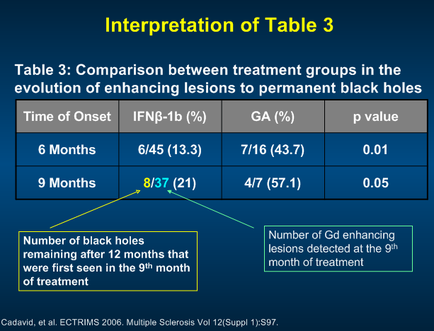
A table that compares the comparison between treatment groups in the evolution of enhancing lesions to permanent black holes. The table is titled "Interpretation of Table 3" and has three columns. The first column is labeled "Time of Onset" and shows the number of black holes remaining after 12 months that were first seen in the 9th month of treatment. The second column is labelled "ifni-1b (1%)". The third column has a table number of 6 months 6/45 (13.3%) 7/16 (43.7%) 4/7 (57.1%) and 0.01. The fourth column has the value of 0.05. The table is divided into two columns with the first column showing the time of onset and the second column displaying the number. The black holes are remaining after the first 12 months and the value is 0.02. The number of Gd enhancing lesions detected at the 9 th month of the treatment is also indicated in the table.
Type
Category
-
Date
2016
Collection
We encourage you to view the image in the context of its source document(s) and cite the source(s) when using these images. However, to cite just this image alone, click the “Cite This Image” button and then paste the copied text.