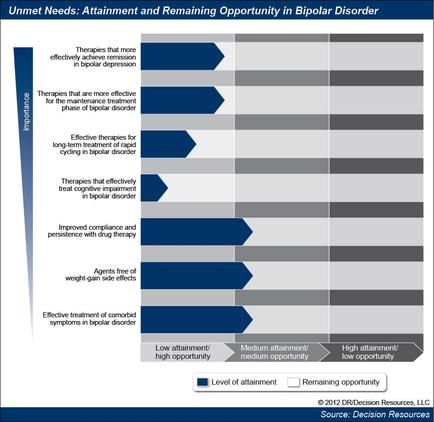
OIDA Image Collection
Filters:
Reset 
A bar graph that shows the level of attainment and remaining opportunity in bipolar disorder. The graph is divided into six sections each representing a different type of treatment. The first section is titled "Unmet Needs: Attainment and Remaining Opportunity in Bipolar Disorder" and has a blue arrow pointing to the top left corner. The second section is labeled "Therapies that are more effective for the treatment of bipolar disorder" and shows that the treatment is more effective than the treatment itself. The third section has a list of different types of treatment options such as "Improved compliance and persistence with drug therapy" "Agents free of weight-gain side effects" "Effective treatment of morbid symptoms" and "Low attainment/medium attainment/high opportunity". The fourth section has an arrow pointing towards the top right corner of the graph indicating that the highest attainment option is higher than the lowest attainment option. The fifth section has two options - "High attainment/low opportunity" and "Remaining opportunity". Overall the graph is a visual representation of the different levels of attainment in the treatment options available for bipolar disorders.

Description Generated using AI

A bar graph that shows the level of attainment and remaining opportunity in bipolar disorder. The graph is divided into six sections each representing a different type of treatment. The first section is titled "Unmet Needs: Attainment and Remaining Opportunity in Bipolar Disorder" and has a blue arrow pointing to the top left corner. The second section is labeled "Therapies that are more effective for the treatment of bipolar disorder" and shows that the treatment is more effective than the treatment itself. The third section has a list of different types of treatment options such as "Improved compliance and persistence with drug therapy" "Agents free of weight-gain side effects" "Effective treatment of morbid symptoms" and "Low attainment/medium attainment/high opportunity". The fourth section has an arrow pointing towards the top right corner of the graph indicating that the highest attainment option is higher than the lowest attainment option. The fifth section has two options - "High attainment/low opportunity" and "Remaining opportunity". Overall the graph is a visual representation of the different levels of attainment in the treatment options available for bipolar disorders.

We encourage you to view the image in the context of its source document(s) and cite the source(s) when using these images. However, to cite just this image alone, click the “Cite This Image” button and then paste the copied text.

Information copied to your clipboard:

"A bar graph that shows the level of attainment and remaining opportunity in bipolar disorder. The graph is divided into six sections each representin...