


Title
Description 
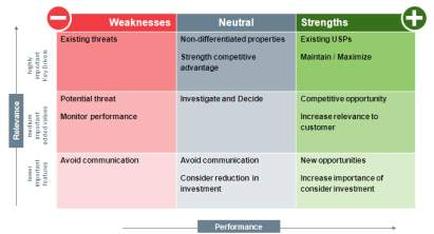
A table that shows the strengths and weaknesses of a company. The table is divided into four quadrants each representing a different aspect of the company's performance. The first quadrant is labeled "Weaknesses" and has a red circle in the top left corner. The second quadrant has a green circle with the word "Strengths" written in white text. The third quadrant shows "Existing threats" and "Potential threat" with a red arrow pointing to the left side of the table. The fourth quadrant displays "Monitor performance" with an arrow pointing towards the right side. The fifth quadrant also has a yellow circle with a green cross in the middle. The sixth quadrant contains "Neutral" and a green rectangle with the words "Strongest competitive advantage" and the seventh quadrant says "Investigate and Decide". At the bottom of the image there is a label that reads "Performance". This indicates that the table is used to assess the performance of the business and how it can be used to improve its performance.
Type
Category
-
Date
2012
Collection
We encourage you to view the image in the context of its source document(s) and cite the source(s) when using these images. However, to cite just this image alone, click the “Cite This Image” button and then paste the copied text.