


Title
Description
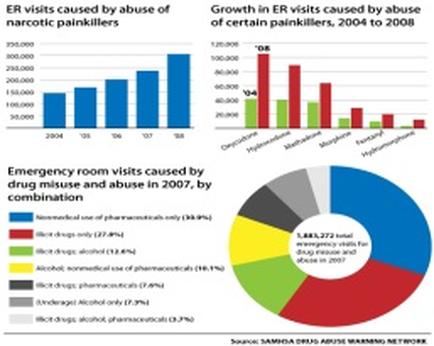
This is an infographic about the causes of drug-related emergency room visits in the United States from 2004-2008 consisting of 3 different data visualizations. There is a run chart showing ER visits caused by abuse of narcotic painkillers (2004 to 2008) a bar chart showing Growth in ER visits caused by abuse of certain painkillers (2004 to 2008) and a pie chart showing Emergency room visits caused by drug misuse and abuse in 2007 (by combinations). The trendline is that abuse of prescription opioids rose every year between 2004 and 2008 to the point where non-medical use of pharmaceuticals was the leading cause of emergency room visits arising from drug misuse and abuse in 2007 (outweighing various combinations of illicit drugs and alcohol).
Type 
Category
-
Date
2014
Collection
We encourage you to view the image in the context of its source document(s) and cite the source(s) when using these images. However, to cite just this image alone, click the “Cite This Image” button and then paste the copied text.