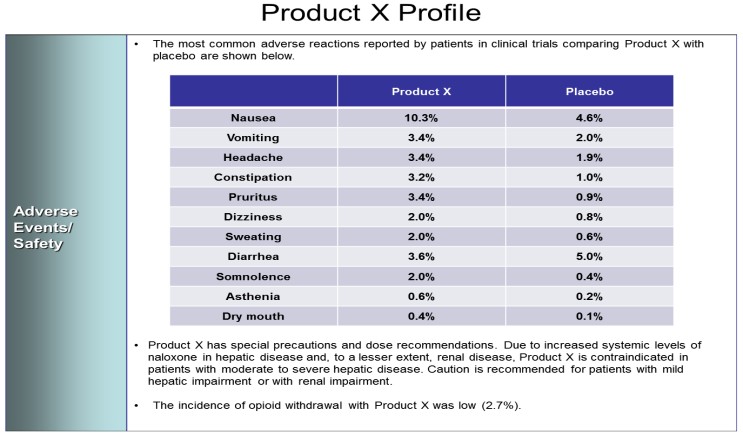
A table with the title "Product X Profile". It lists 11 common adverse reactions reported by patients in clinical trials to both Product X and a Placebo (ex : Nausea was reported by 10.3% of patients given Product X vs. 4.6% of patients given the Placebo). There are also disclaimers (ex : contraindications) and contextualizing information (ex : opioid withdrawal rates). The background is white with graphic elements in green and purple and text in black.
Description
Type
Category
-
Date
2013
Collection
We encourage you to view the image in the context of its source document(s) and cite the source(s) when using these images. However, to cite just this image alone, click the “Cite This Image” button and then paste the copied text.


