


Title
Description 
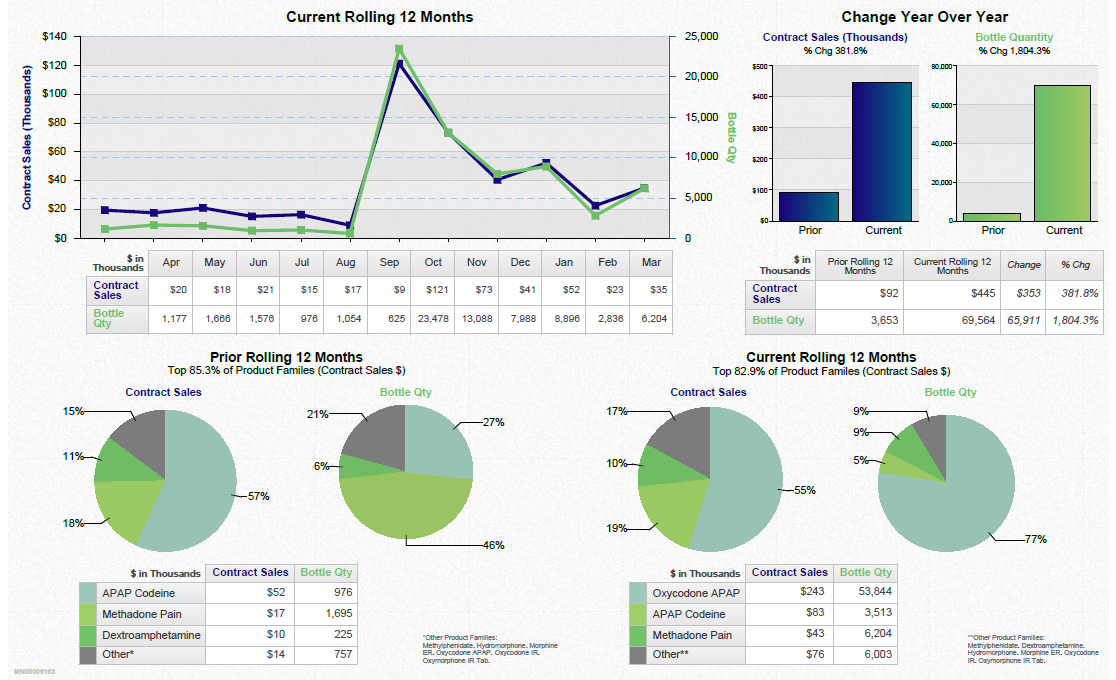
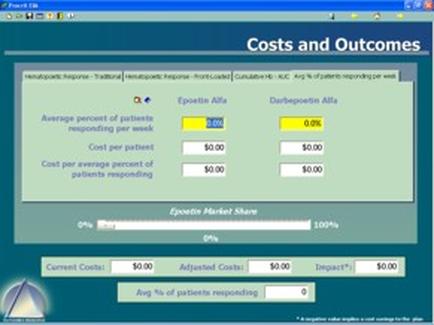
A screenshot of a medical report titled "Costs and Outcomes". It is a table that shows the average percentage of patients responding per week for a patient. The table is divided into three columns. The first column is titled "Average percent of patients" and has a yellow bar at the top. The second column is labeled "Cost per patient" and shows the cost per average percent of the patient responding. The third column has a green bar with a yellow arrow pointing to the right indicating that the cost is 0.0%. At the bottom of the table there are two buttons - "Current Costs" and "Adjusted Costs". The current costs are $0.00 and the adjusted costs are 10.00 respectively. There is also a "Impact" button at the bottom right corner which is likely used to adjust the impact of the report on the patient's response.
Type
Category
-
Date
2012
Collection
We encourage you to view the image in the context of its source document(s) and cite the source(s) when using these images. However, to cite just this image alone, click the “Cite This Image” button and then paste the copied text.