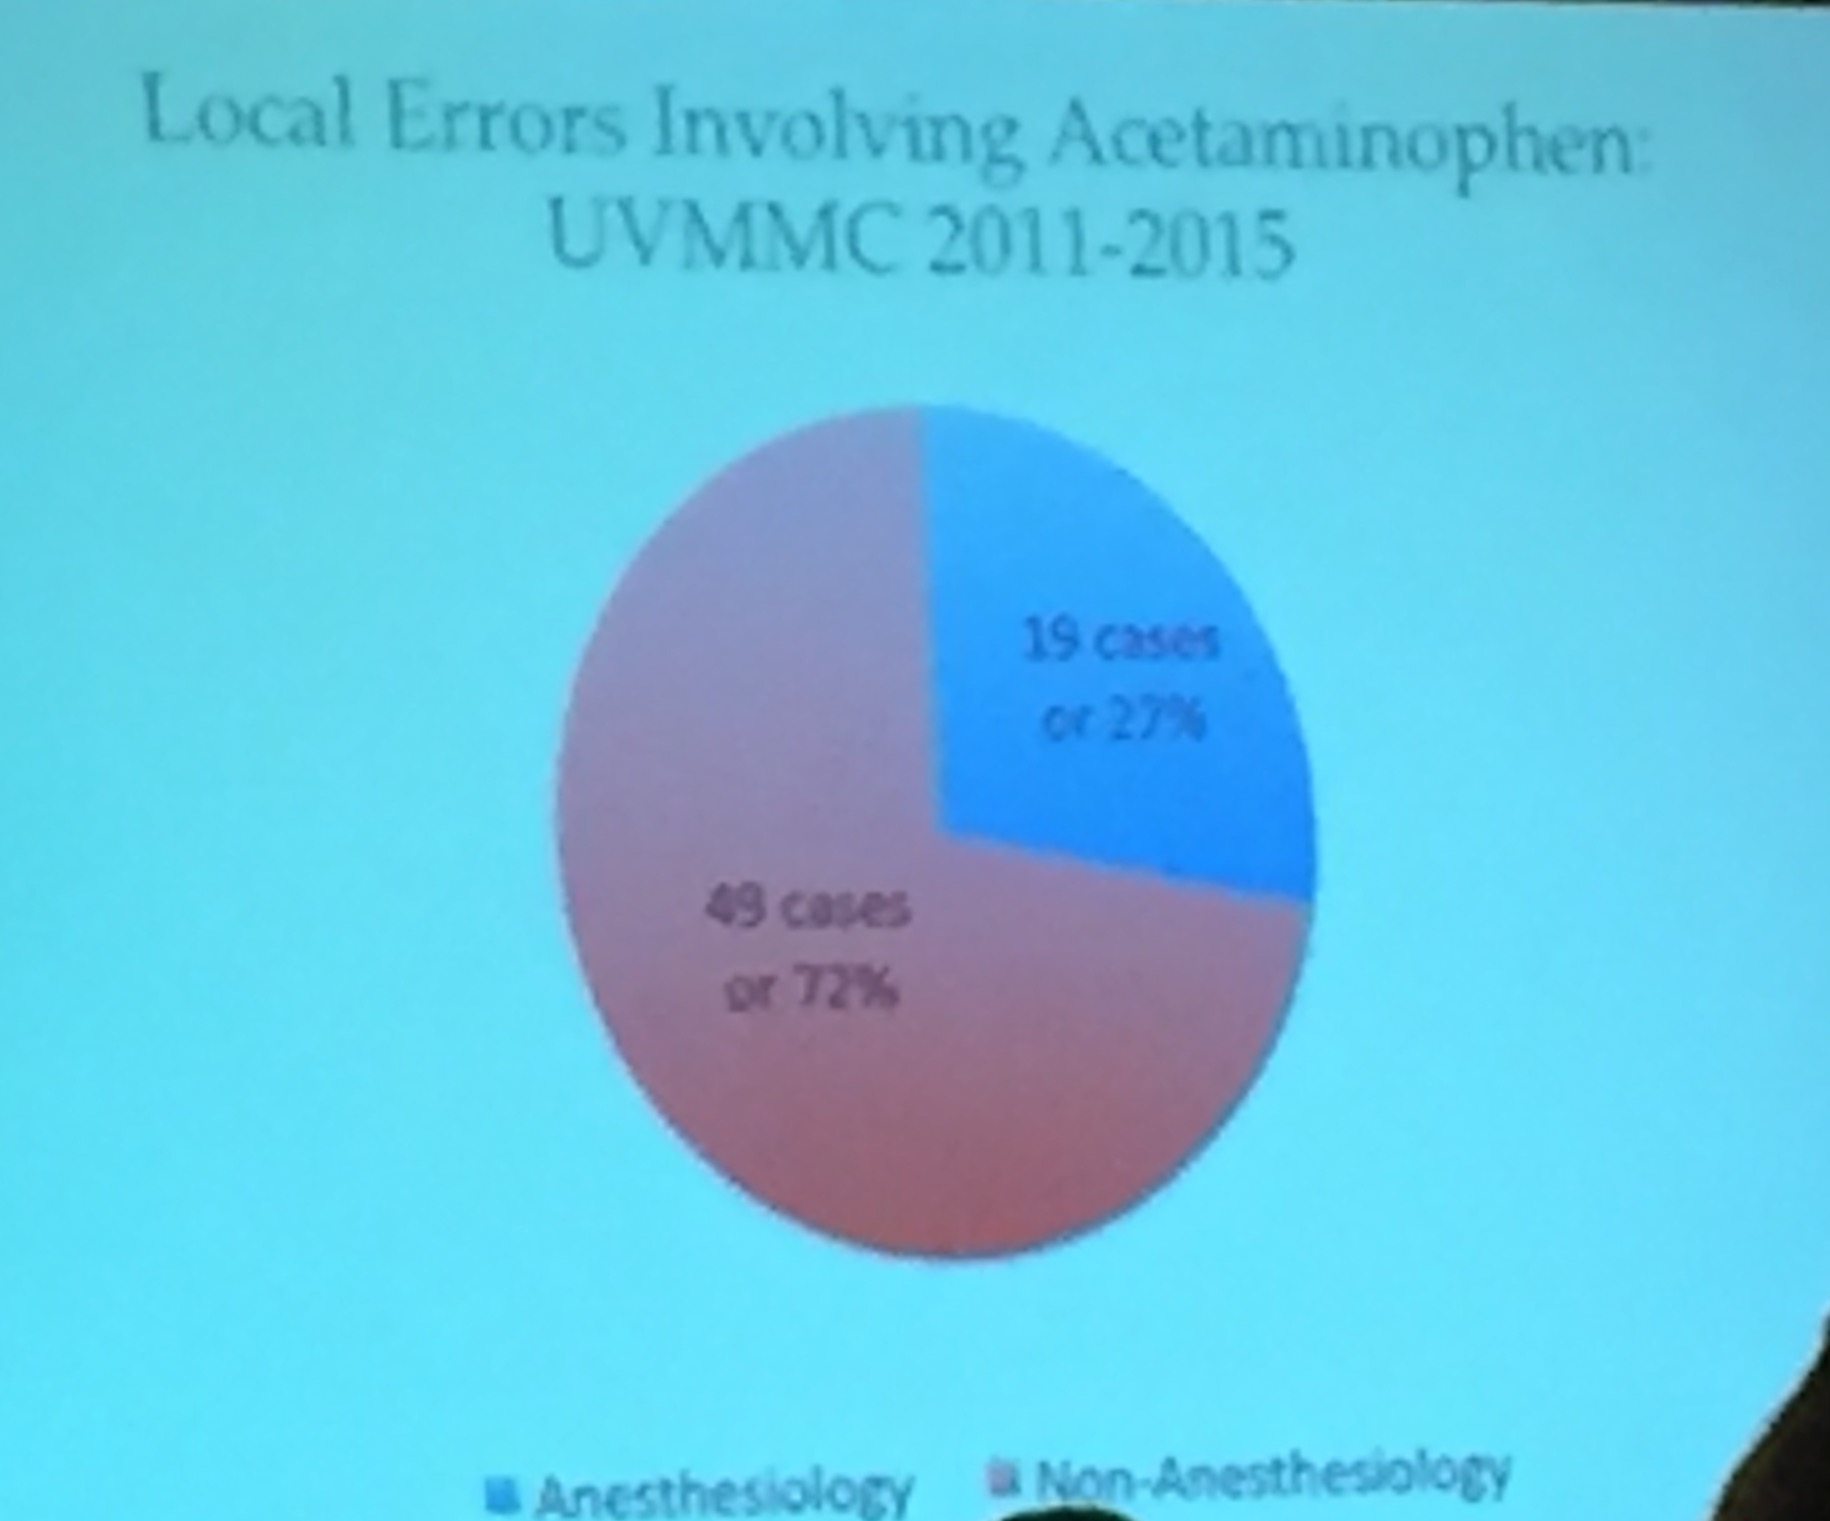
A pie chart with the title "Local Errors Involving Acetaminophen : UVMMC 2011-2015". It shows that 49 of the cases (72%) occurred in a Non-Anesthesiology setting and 19 of the cases (27%) occurred in an Anesthesiology setting. It appears to be part of a presentation about the University of Vermont Medical Center. The background is light blue with pie slices in red and blue and text in black.
Description
Category
-
Date
2016
Collection
We encourage you to view the image in the context of its source document(s) and cite the source(s) when using these images. However, to cite just this image alone, click the “Cite This Image” button and then paste the copied text.
