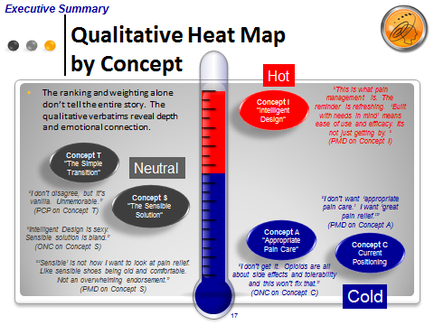
A visual representation of a qualitative heat map by Concept. It shows a thermometer with a red and blue color scheme representing the temperature. The thermometer is divided into four sections each representing a different aspect of the heat map. The first section is titled "Executive Summary" and has a title that reads "Qualitative Heat Map by Concept". The second section is labeled "The ranking and weighting alone don't tell the entire story. The qualitative heatmaps reveal depth and emotional connection." The third section has a description of the concept "Neutral" and a description that explains the concept. The fourth section has an image of a person's face with a cold expression. The fifth section has the words "Concept A" and "Cold" written on it respectively. The sixth section has two circles one labeled "Hot" and the other labeled "Cold". Overall the image is meant to illustrate the concept of qualitative heat maps and how they can be used to measure the temperature in a specific area.
Description 
Type
Category
-
Date
2015
Collection
We encourage you to view the image in the context of its source document(s) and cite the source(s) when using these images. However, to cite just this image alone, click the “Cite This Image” button and then paste the copied text.