


Title
Description 
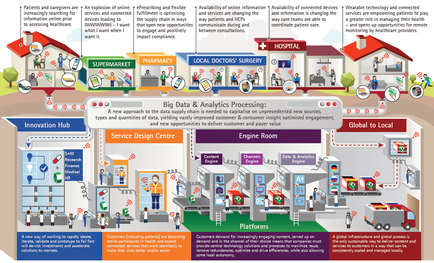
This is an infographic showing how big data and analytics processing could potentially effect the pharmaceutical industry with relevant examples from supermarkets pharmacies local doctors' surgery and hospitals (on the top row) and innovation hubs service design centers engine room (platforms) and global to local (on the bottom row). The subtext is that the availability of more information will have a transformative effect on the health care industry and that appropriate use of technology could improve both medical care (for patients) and profitability (for companies).
Type
Category
Source 1 of 10
-
Date
2016
Collection
-
Date
2016
Collection
-
Date
2016
Collection
-
Date
2016
Collection
-
Date
2016
Collection
-
Date
2016
Collection
-
Date
2016
Collection
-
Date
2016
Collection
-
Date
2016
Collection
-
Date
2016
Collection
We encourage you to view the image in the context of its source document(s) and cite the source(s) when using these images. However, to cite just this image alone, click the “Cite This Image” button and then paste the copied text.