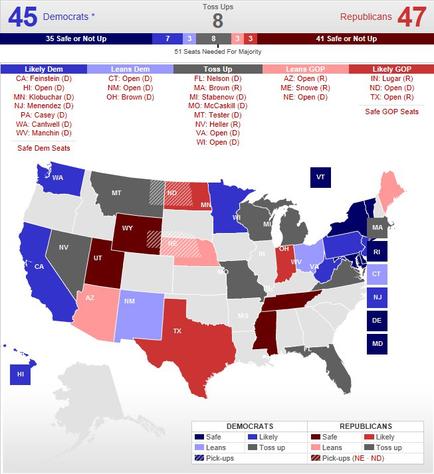
OIDA Image Collection
Filters:
Reset 
A map of the United States showing the percentage of Democrats in each state. The map is color-coded with each state in red blue and gray representing a different party. The states are labeled with their respective party names such as "Democrats" and "Republicans". The map also includes a table that shows the number of Democrats who have voted in the presidential election with 45 Democrats at the top and 47 Republicans at the bottom. The table also shows that 45 Democrats are safe or not up while 47 Republicans are not up. There are also several bars on the map each representing a party named "Democrats". The bars are arranged in a grid-like pattern with the highest bar at the left and the lowest at the right. The colors of the bars vary with some being red white and blue while others are gray. The text on the table provides further information about the party's policies and policies.

Description Generated using AI

A map of the United States showing the percentage of Democrats in each state. The map is color-coded with each state in red blue and gray representing a different party. The states are labeled with their respective party names such as "Democrats" and "Republicans". The map also includes a table that shows the number of Democrats who have voted in the presidential election with 45 Democrats at the top and 47 Republicans at the bottom. The table also shows that 45 Democrats are safe or not up while 47 Republicans are not up. There are also several bars on the map each representing a party named "Democrats". The bars are arranged in a grid-like pattern with the highest bar at the left and the lowest at the right. The colors of the bars vary with some being red white and blue while others are gray. The text on the table provides further information about the party's policies and policies.

Type Generated using AI

Category Generated using AI

We encourage you to view the image in the context of its source document(s) and cite the source(s) when using these images. However, to cite just this image alone, click the “Cite This Image” button and then paste the copied text.

Information copied to your clipboard:

"A map of the United States showing the percentage of Democrats in each state. The map is color-coded with each state in red blue and gray representin...