


Title
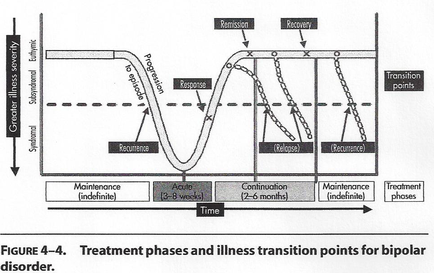
Description
This is a run chart showing the treatment phases and illness transition points for bipolar disorder. Time (with treatment phases) is on the x-axis and Illness severity is on the y-axis. Illness transition points - Recurrence Response Remission Recovery etc. - are also labelled.
Type 
Category
-
Date
2012
Collection
We encourage you to view the image in the context of its source document(s) and cite the source(s) when using these images. However, to cite just this image alone, click the “Cite This Image” button and then paste the copied text.