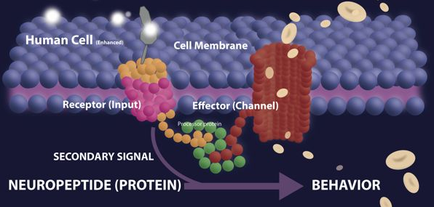
A diagram that shows the structure of a human cell and its effects on the behavior of a neuron. The diagram is divided into two sections. The top section shows the human cell which is represented by a blue sphere on the left side of the image. The human cell is enhanced by a receptor (Input) and a cell membrane on the right side. The receptor is represented as a pink and yellow sphere representing the receptor input. The cell membrane is shown as an effector (Channel) and the effector channel is shown in the center of the diagram. The effector is shown on the top right corner of the cell membrane which represents the effect of the receptor on the neuron. There are also several smaller spheres in the image representing different types of neurons. The receptors are represented by different colors - pink yellow green and orange. The neurons are arranged in a circular pattern with the red and orange spheres representing the receptors and the green and yellow spheres representing neurons. There is also a secondary signal (Neuropeptide (Protein) in the bottom left corner which means that the neuron is responsible for the production of neurotransmitters in the brain. The image also shows the behavior in the neuron which helps to regulate the neurotransmitter's behavior.
Description 
Type
Category
-
Date
2016
Collection
We encourage you to view the image in the context of its source document(s) and cite the source(s) when using these images. However, to cite just this image alone, click the “Cite This Image” button and then paste the copied text.