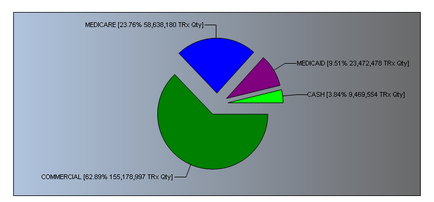
A pie chart that shows the percentage of people who have been diagnosed with cancer. The chart is divided into three sections each representing a different type of cancer. The largest section in the chart is blue representing the number of people diagnosed with the disease. The smallest section is green representing a percentage of the patients who have experienced the disease with the largest section being the largest and the smallest being the smallest. The pie chart also shows that the majority of the pie charts are in blue indicating that the percentage is higher than the rest of the chart. There are also three smaller sections in the pie chart - one in green one in purple and one in pink. The largest section is in blue and represents the percentage while the smallest segment is in pink and represents a percentage. The smaller section in green is in red and represents an percentage with a percentage that is higher. The larger section in pink is in purple and represents another percentage and the smaller segment in blue is in green. - MEDICARE (23.76% of patients) has the highest percentage followed by the lowest percentage which is the highest. The highest percentage is "CASH (3.84%" which is "9.49%" and the lowest percent is "TRX (4.78%". Overall the chart shows that there are three types of cancer patients in the United States that have experienced a significant increase in their mortality rate.

Category
Source 1 of 2
-
Date
2018
Collection
-
Date
2011
Collection
We encourage you to view the image in the context of its source document(s) and cite the source(s) when using these images. However, to cite just this image alone, click the “Cite This Image” button and then paste the copied text.