OIDA Image Collection
Filters:
Reset 
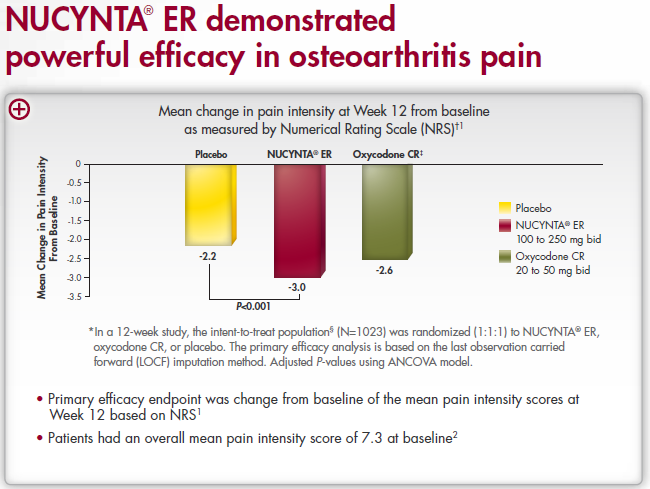
A bar graph that shows the mean change in pain intensity in osteoarthritis pain. The x-axis of the graph is labeled "NUCYNTA ER demonstrated powerful efficacy in osteopathic pain" and the y-axis is labeled as "Mean change in Pain intensity at Week 12 from baseline as measured by Numerical Rating Scale (NRS)". <br /><br />There are four bars in the graph each representing a different stage of the pain intensity. The first bar is yellow the second is red the third is green and the fourth is orange. The bars are arranged in a horizontal line with the highest bar at the top and the lowest at the bottom.<br /><br />The first bar on the left shows the percentage change in the number of patients who have been diagnosed with NUCYNTA ER which is a type of osteopathic treatment. The second bar shows that the majority of patients had an overall mean pain intensity score of 7.3 at baseline. The third bar shows a decrease in the percentage of patients diagnosed with the same pain intensity as the first bar. The fourth bar shows an increase in the severity of the severity with a decrease of 2.2%.<br /><br />Overall the graph shows a positive effect on the overall pain intensity of the NUCYCYNA ER as indicated by the red bars.
Description Generated using AI

A bar graph that shows the mean change in pain intensity in osteoarthritis pain. The x-axis of the graph is labeled "NUCYNTA ER demonstrated powerful efficacy in osteopathic pain" and the y-axis is labeled as "Mean change in Pain intensity at Week 12 from baseline as measured by Numerical Rating Scale (NRS)".

There are four bars in the graph each representing a different stage of the pain intensity. The first bar is yellow the second is red the third is green and the fourth is orange. The bars are arranged in a horizontal line with the highest bar at the top and the lowest at the bottom.

The first bar on the left shows the percentage change in the number of patients who have been diagnosed with NUCYNTA ER which is a type of osteopathic treatment. The second bar shows that the majority of patients had an overall mean pain intensity score of 7.3 at baseline. The third bar shows a decrease in the percentage of patients diagnosed with the same pain intensity as the first bar. The fourth bar shows an increase in the severity of the severity with a decrease of 2.2%.

Overall the graph shows a positive effect on the overall pain intensity of the NUCYCYNA ER as indicated by the red bars.

We encourage you to view the image in the context of its source document(s) and cite the source(s) when using these images. However, to cite just this image alone, click the “Cite This Image” button and then paste the copied text.

Information copied to your clipboard:

"A bar graph that shows the mean change in pain intensity in osteoarthritis pain. The x-axis of the graph is labeled "NUCYNTA ER demonstrated pow...