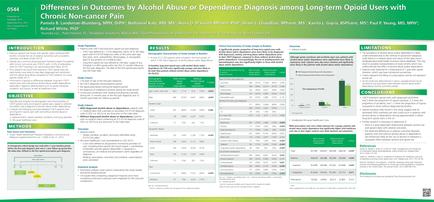
A table that shows the differences in outcomes by alcohol abuse or dependence diagnosis among long-term opioid users with chronic non-cancer pain. The table is divided into three columns and three rows. The first column is titled "Introduction" and has a title that reads "Results". The second column has a list of results and a bar graph that shows a decrease in the number of people who have been diagnosed with the condition. The third column has two columns one labeled "Results" and the other labeled "Limitations". The table also has a section titled "Objective" which provides an overview of the results. At the bottom of the table there is a section labeled "Methods" which lists the methods used in the treatment. The first column shows the results of the treatment while the second column displays the results from the treatment and the third column shows that the results have decreased. The fourth column has the results in the results and the fifth column shows how the results are calculated. The sixth column has graphs and charts that show the percentage of patients who have experienced the treatment for the condition with the highest percentage being in the first column and the lowest percentage being at the bottom. The seventh column has charts and graphs that show that the patient has experienced a decrease. The eighth column has data that shows that there are no symptoms or symptoms of the condition and the ninth column has an increase in the percentage.
Description 
Type
Category
-
Date
2015
Collection
We encourage you to view the image in the context of its source document(s) and cite the source(s) when using these images. However, to cite just this image alone, click the “Cite This Image” button and then paste the copied text.