


Title
Description 
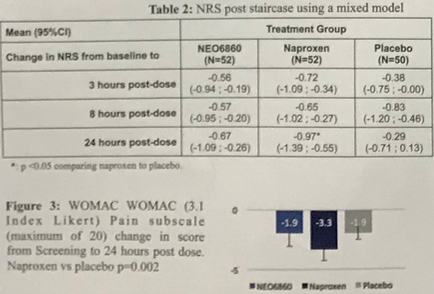
A table that shows the results of a treatment group using a mixed model. The table is titled "Table 2: NRS post staircase using a Mixed model" and has three columns. The first column is labeled "Change in NRS from baseline to" and shows the mean (95%) of the treatment group. The second column is "NEO6860" and the third column is labelled "Naproxen (N=52)". The table shows that the treatment groups have a range of 3 hours post-dose and a maximum of 20% change in score from screening to 24 hours post dose. There are also two bars on the table one labeled "Figure 3: woman woman (3.1 Index likest) Pain subspace" and another labeled "3.3". The first bar shows that there is a decrease in the number of patients who have been diagnosed with Naproxen while the second bar shows a decrease. The third bar shows the percentage of patients with the highest percentage of pain subspaces. The fourth bar shows an increase in the percentage with the lowest percentage.
Type
Category
-
Date
2017
Collection
We encourage you to view the image in the context of its source document(s) and cite the source(s) when using these images. However, to cite just this image alone, click the “Cite This Image” button and then paste the copied text.