


Title
Description 
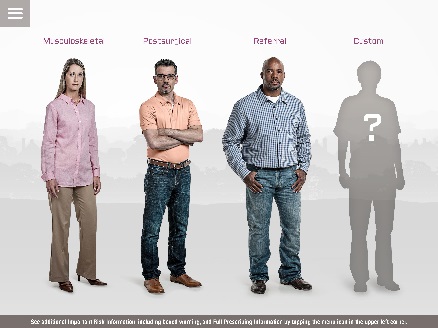
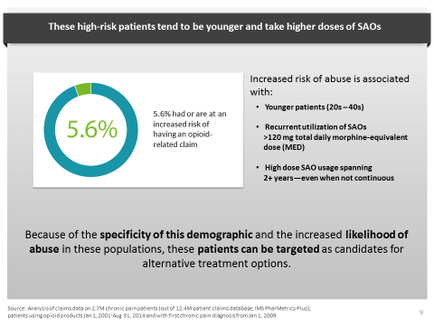
This is an infographic explaining variables in patient demographics that present an increased risk of abuse of SAOs (short-acting opioids). Younger patients that use high doses of SAOs for 2+ years are considered to have an increased risk of abuse and may be candidates for alternative treatment options.
Type
Category
Source 1 of 3
-
Date
2015
Collection
-
Date
2015
Collection
-
Date
2015
Collection
We encourage you to view the image in the context of its source document(s) and cite the source(s) when using these images. However, to cite just this image alone, click the “Cite This Image” button and then paste the copied text.