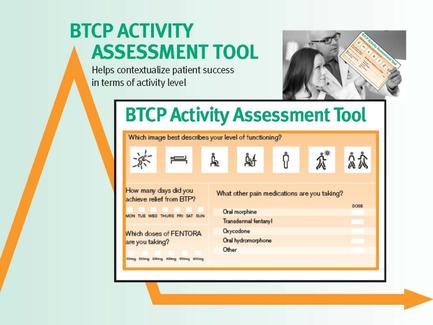
An idiographic titled "BTCP Activity Assessment Tool". It has a white background with a yellow triangle on the left side. On the right side there is a black and white photo of a man and a woman holding a clipboard and smiling at each other. Below the photo there are six icons representing different activities related to the activity. The first icon is a list of activities that can help contextualize patient success in terms of activity level. The second icon is an illustration of a person with a stethoscope around their neck. The third icon is of a group of people with different facial expressions. The fourth icon is titled "How many days did you achieve relief from BTP?" The fifth icon is labeled "What other pain medications are you taking?" The sixth icon is labelled "Oral morphine" the seventh icon is highlighted in orange and the eighth icon is colored in green. At the bottom of the idiographic it has a title that reads "Which image best describes your level of functioning?" and a brief description of each activity.
Description 
Type
Category
Source 1 of 2
-
Date
2012
Collection
-
Date
2012
Collection
We encourage you to view the image in the context of its source document(s) and cite the source(s) when using these images. However, to cite just this image alone, click the “Cite This Image” button and then paste the copied text.