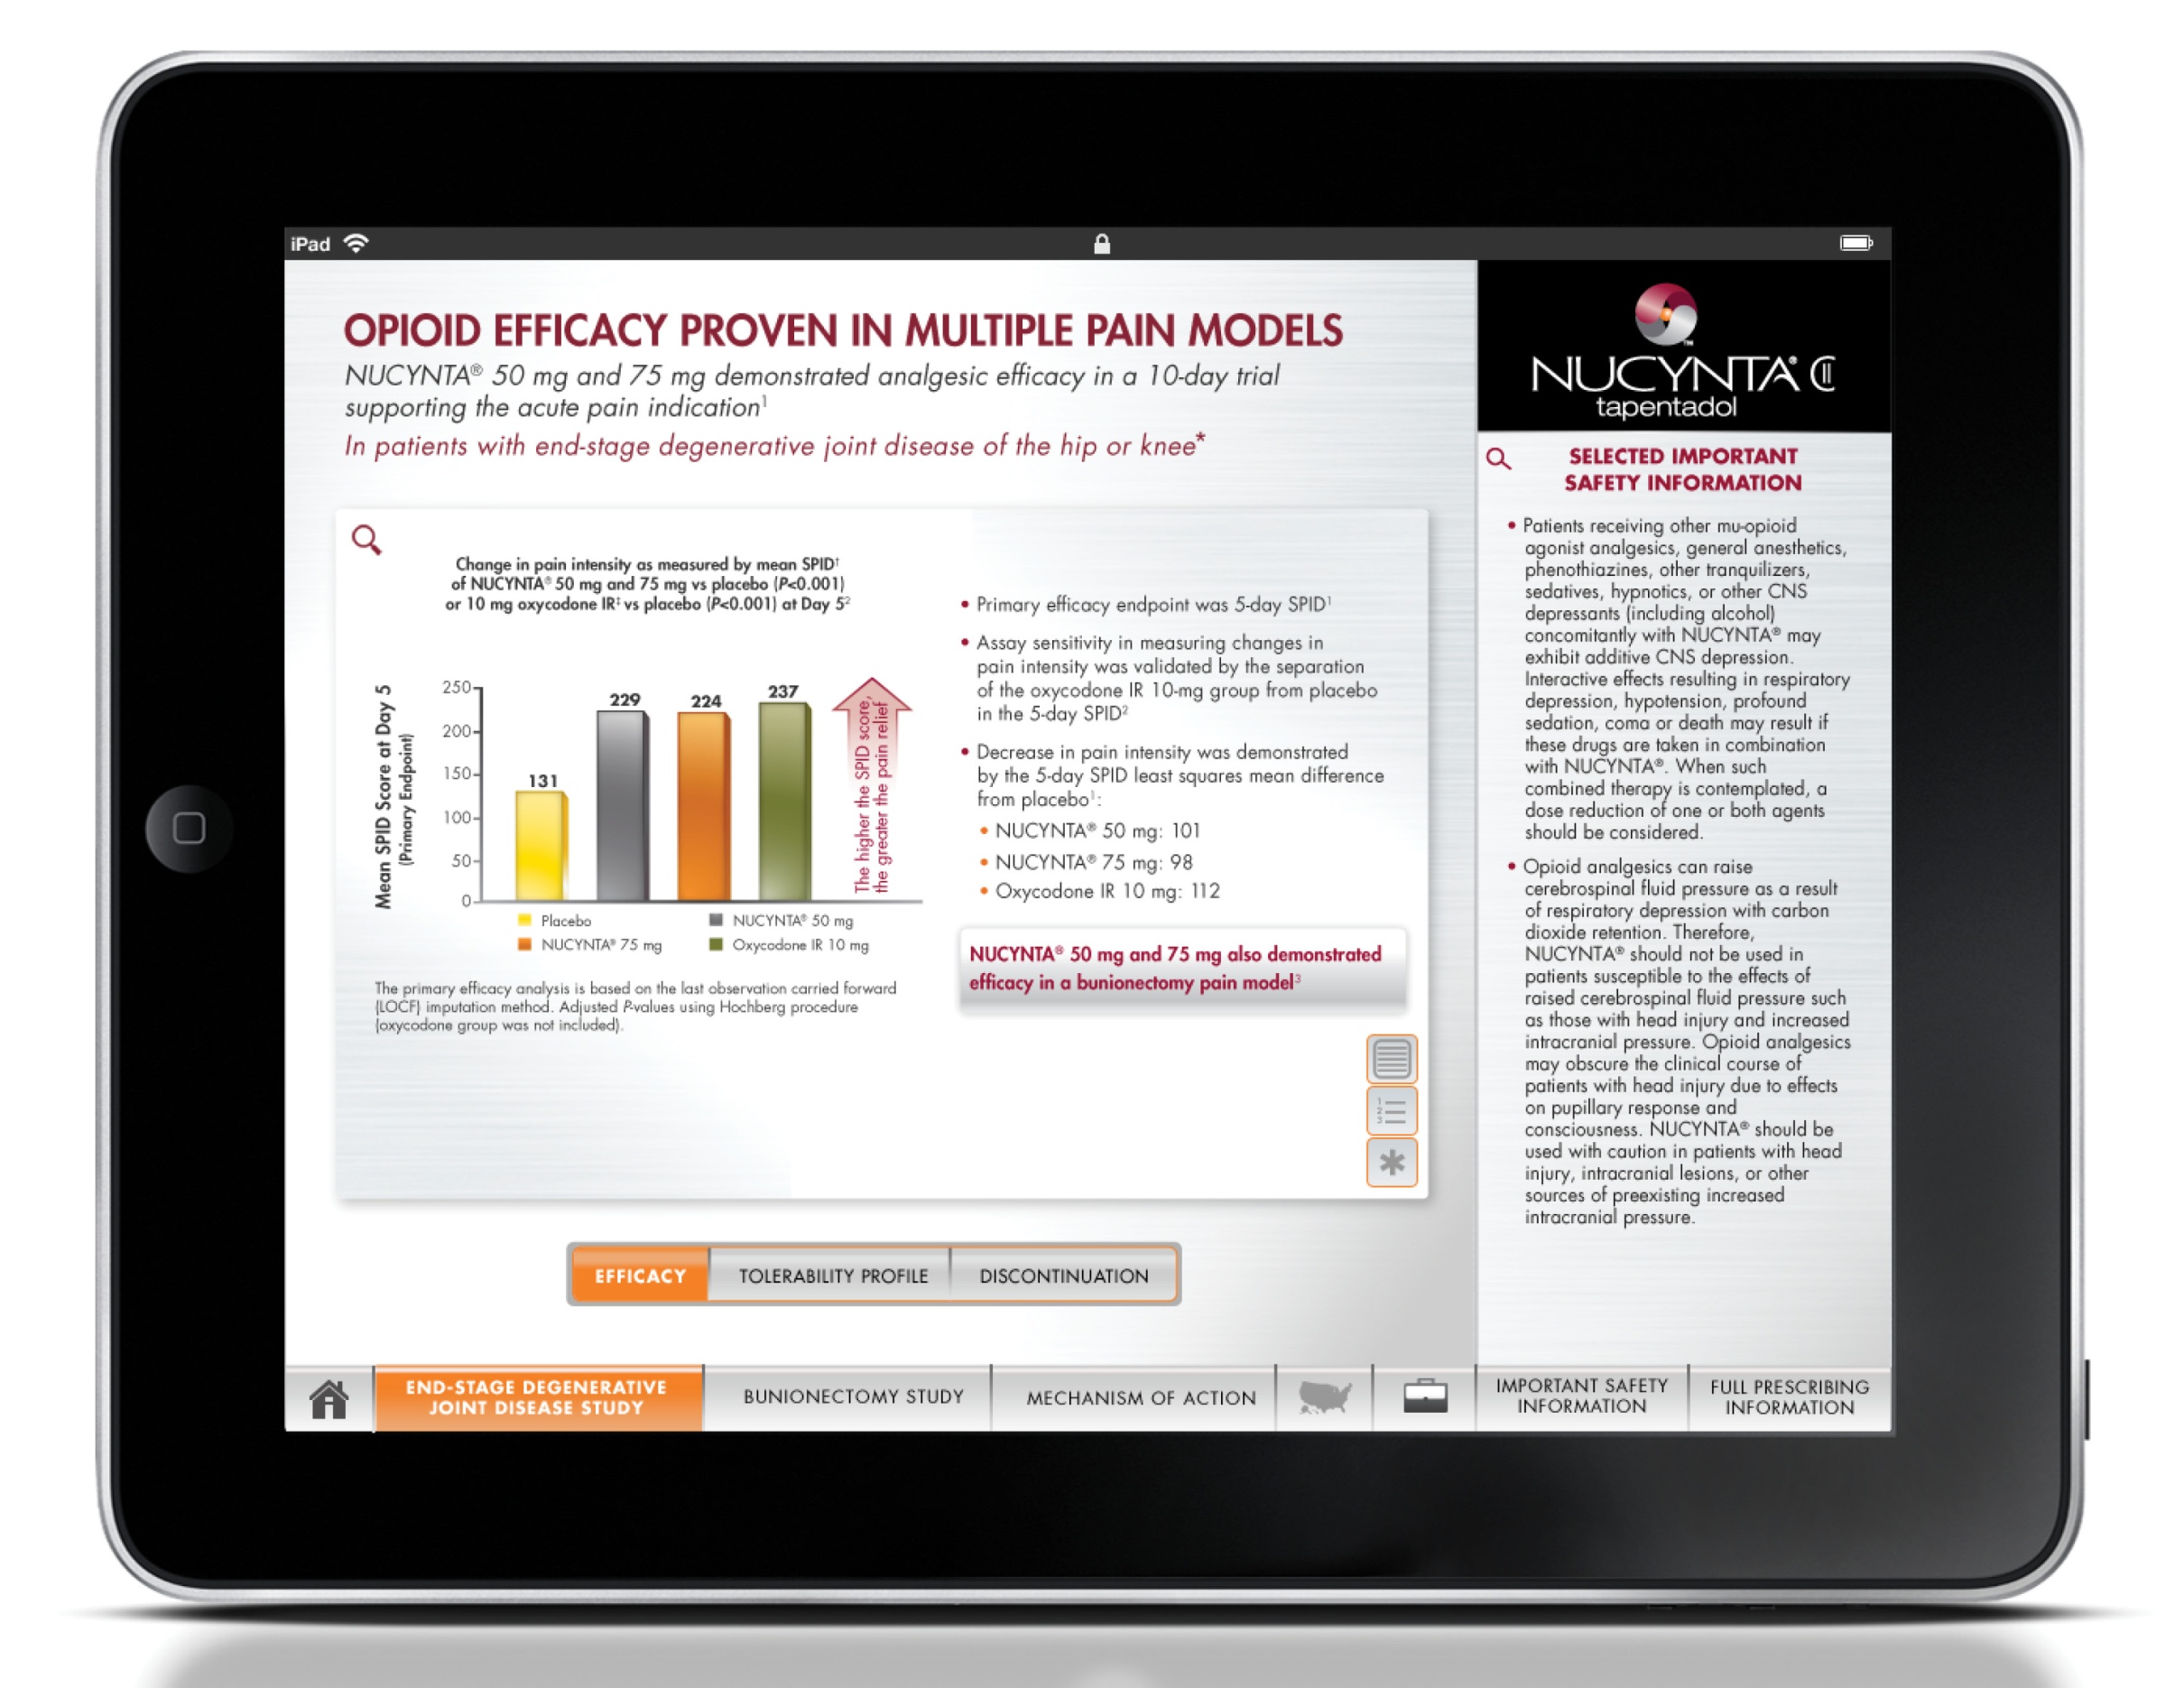
A screenshot of an iPad screen displaying an article titled "Opioid Efficiency Proven in Multiple Pain Models". The background of the screen is white and the text is black.
The article is divided into two sections. The top section has a title that reads "OPIOID EFFICACY PROVEN IN MULTIPLE PAIN MODELS" in bold black font. Below the title there is a bar graph that shows change in pain intensity for NUCYNTA patients vs. patients taking a placebo.
On the right side of the page there is a side bar with the NUCYNTA logo and selected important safety information. At the bottom of the image there is a navigation menu.

Description
Category
Source 1 of 2
-
Date
2010
Collection
-
Date
2010
Collection
We encourage you to view the image in the context of its source document(s) and cite the source(s) when using these images. However, to cite just this image alone, click the “Cite This Image” button and then paste the copied text.


![A screenshot of the Formulary update page of the XARTEMIS XR (oxycodone HCI and acetaminophen Extended-Release Tablets (CII) website. The page has a white background with a yellow header and footer. The header reads "Formulary update" in bold black font. Below the header there is a text box with the text "XARTEMIS XR is available unrestricted on [tier #1] for [Plan Name] Commercial Patients. No PA/step therapy requirement. Patients will have an average co-pay of $1". <br /><br />At the bottom of the page there are two buttons - "FORMULARY UPDATE" and "FORMULAR UPDATE". The first button is for the user to click on the "formulary update" button and the second button is to view additional information about the product.<br /><br />On the right side of the image the page has the logo of the website which is a purple and white shield with the company's name and contact information. At the top right corner the time and date of the update is 11:27 AM.](https://oida-resources-images.azureedge.net/public/full/06af7f03-9e0c-4f16-8a36-e3a2e5d38325.png)


