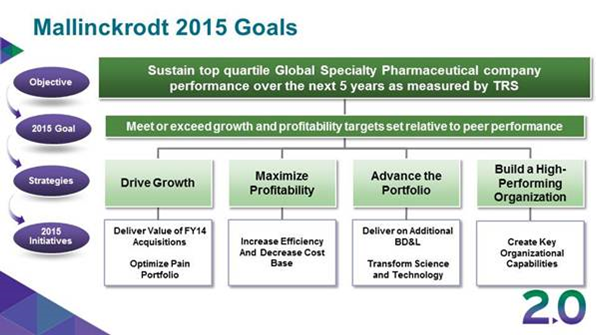
A flowchart that shows the goals of Mallinckrodt 2015. It is a visual representation of the company's sustainability top quartile global specialty pharmaceutical company performance over the next 5 years as measured by TRS.
The flowchart is divided into six sections each representing a different stage of the goals. The first section is labeled "Objective" and has a purple arrow pointing to the next stage. The second section is titled "Drive Growth" and is labeled as "Maximize Profitability". The third section is labeled as "Advance the Portfolio". The fourth section has labeled "Build a High-Performing Organization". The fifth section has labeled "Create Key Organizational Capabilities". The sixth section has "Optimize Pain Portfolio" and "Increase Efficiency and Decrease Cost Base".
At the bottom of the flowchart there is a note that reads "2.0".
Category
Source 1 of 10
-
Date
2013
Collection
-
Date
2014
Collection
-
Date
2014
Collection
-
Date
2014
Collection
-
Date
2014
Collection
-
Date
2014
Collection
-
Date
2014
Collection
-
Date
2013
Collection
-
Date
2014
Collection
-
Date
2014
Collection
We encourage you to view the image in the context of its source document(s) and cite the source(s) when using these images. However, to cite just this image alone, click the “Cite This Image” button and then paste the copied text.
