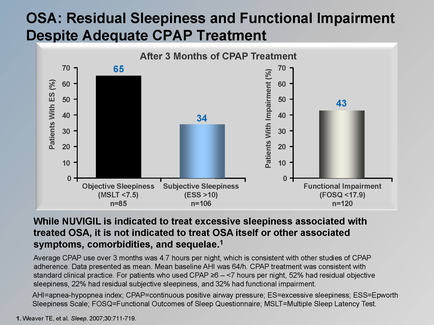
OIDA Image Collection
Filters:
Reset 
A bar graph that shows the results of a study conducted by the OSA (OSA) Residual Sleepiness and Functional Impairment Despite Adequate crap Treatment. The x-axis of the graph is labeled with the title "OSA: ResidUAL SLEEPINESS AND FUNCTIONAL IMPAIRMENT DESPITE ADEQUATE crap TREATMENT" and the y-axis is labeled as "After 3 Months of crap treatment". There are three bars in the graph each representing a different treatment. The first bar is labeled "Objective Sleepiness" and shows the percentage of patients who have been treated with crap (crap) after 3 months of treatment. The second bar is titled "Functional Impairments" and has a vertical axis labeled "45". The third bar is labelled "43". The fourth bar has a horizontal axis labeled as functional impairment. The fifth bar has an upward trend indicating that the treatment is not indicated to treat excessive sleepiness associated with treated OSA but it is not recommended to treat OSA itself or other associated symptoms comorbidities and sequenced. The graph also has a legend at the bottom that explains the meaning of each bar.

Description Generated using AI

A bar graph that shows the results of a study conducted by the OSA (OSA) Residual Sleepiness and Functional Impairment Despite Adequate crap Treatment. The x-axis of the graph is labeled with the title "OSA: ResidUAL SLEEPINESS AND FUNCTIONAL IMPAIRMENT DESPITE ADEQUATE crap TREATMENT" and the y-axis is labeled as "After 3 Months of crap treatment". There are three bars in the graph each representing a different treatment. The first bar is labeled "Objective Sleepiness" and shows the percentage of patients who have been treated with crap (crap) after 3 months of treatment. The second bar is titled "Functional Impairments" and has a vertical axis labeled "45". The third bar is labelled "43". The fourth bar has a horizontal axis labeled as functional impairment. The fifth bar has an upward trend indicating that the treatment is not indicated to treat excessive sleepiness associated with treated OSA but it is not recommended to treat OSA itself or other associated symptoms comorbidities and sequenced. The graph also has a legend at the bottom that explains the meaning of each bar.

We encourage you to view the image in the context of its source document(s) and cite the source(s) when using these images. However, to cite just this image alone, click the “Cite This Image” button and then paste the copied text.

Information copied to your clipboard:

"A bar graph that shows the results of [...]." OIDA Image Collection. Available at https://images.oida-resources.jhu.edu/ee16c1af-670d-450c-a0d6-28dea...