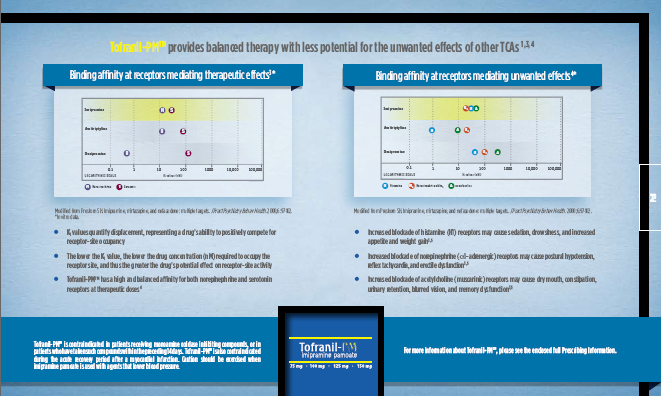
An advertisement for Tofranil PM. It is divided into two sections each with a scatterplot and three bullet points of explanatory text. The scatterplot on the left is titled: "Binding affinity at receptor mediating therapeutic effects". The scatterplot on the right is titled: "Binding affinity at receptor mediating unwanted effects". The bottom of the page includes additional product information as well as the Tofranil PM logo.
Description
Type
Category
Source 1 of 9
-
Date
2010
Collection
-
Date
2009
Collection
-
Date
2010
Collection
-
Date
2010
Collection
-
Date
2010
Collection
-
Date
2010
Collection
-
Date
2009
Collection
-
Date
2009
Collection
-
Date
2010
Collection
We encourage you to view the image in the context of its source document(s) and cite the source(s) when using these images. However, to cite just this image alone, click the “Cite This Image” button and then paste the copied text.


