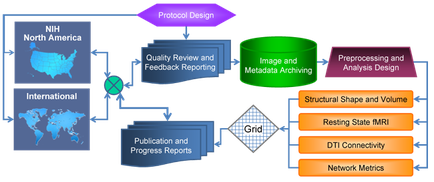
A diagram that shows the different types of network metrics that are used in the North America region of the United States. The diagram is divided into four sections each representing a different type of network. The first section is labeled "NIH North America" and shows a map of North America with the text "Quality Review and Feedback Reporting" above it. The second section is titled "Quality review and feedback reporting" and has a green checkmate next to it. In the third section there is a green circle with the words "Image and Metadata Archiving" inside it representing the process of image and metadata archiving. The fourth section is labelled "reprocessing and Analysis Design" and contains text that explains the process in detail. The fifth section is highlighted in orange and shows the structure of the network metrics including "Structural Shape and Volume" "Resting State fri" "DTI Connectivity" and "Network Metrics". Overall the diagram represents the various components of a network that is used to analyze and analyze data and improve the performance of a website or application.
Description 
Type
Category
Source 1 of 4
-
Date
2015
Collection
-
Date
2015
Collection
-
Date
2015
Collection
-
Date
2015
Collection
We encourage you to view the image in the context of its source document(s) and cite the source(s) when using these images. However, to cite just this image alone, click the “Cite This Image” button and then paste the copied text.