OIDA Image Collection
Filters:
Reset 
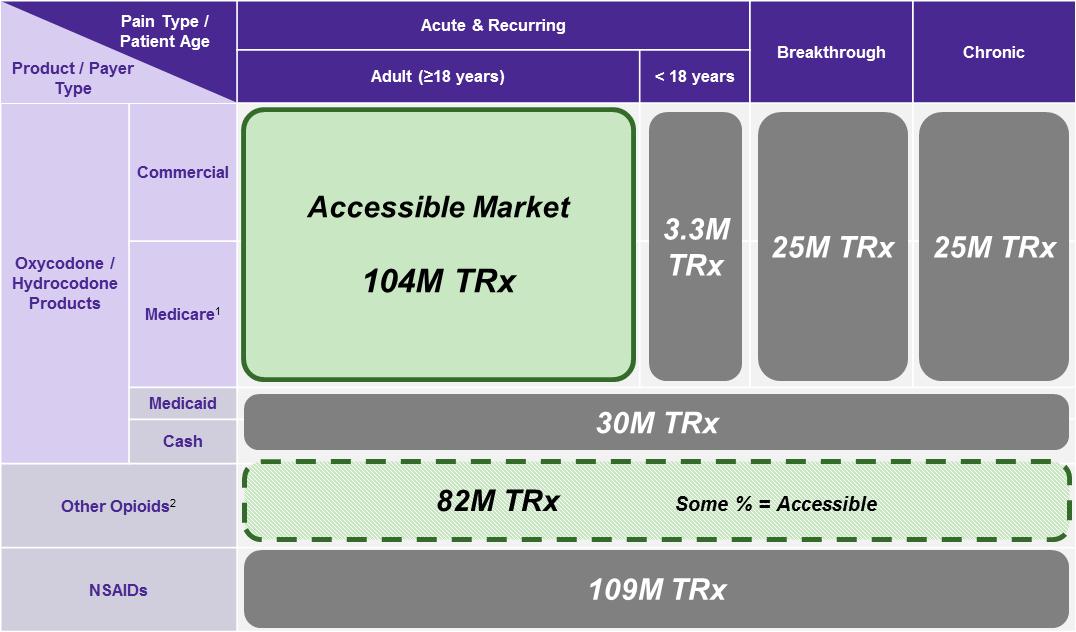
A table that shows the different types of accessible markets in the United States. The table is divided into four quadrants each representing a different type of market.<br /><br />The first quadrant is labeled "Accessible Market" and shows the number of products available in each market. The second quadrant has a green square with the text "104M TRX" in the center. The third quadrant shows the market size of the market with 3.3M TRx being the largest and the fourth quadrant representing the smallest. The fifth quadrant also has a gray square with text that reads "Breakthrough" and "Chronic".<br /><br />At the top of the table there is a label that says "Pain Type/Patient Age" and below that it says "Acute & Recurring". The table also mentions that the market is for adult (18 years) and that it is for 18 years old. The market size is for commercial Oxycodone/Hydrocodone/Medicare Medicare Medicaid Cash Other Opioids and NSAIDS.

Description Generated using AI

A table that shows the different types of accessible markets in the United States. The table is divided into four quadrants each representing a different type of market.

The first quadrant is labeled "Accessible Market" and shows the number of products available in each market. The second quadrant has a green square with the text "104M TRX" in the center. The third quadrant shows the market size of the market with 3.3M TRx being the largest and the fourth quadrant representing the smallest. The fifth quadrant also has a gray square with text that reads "Breakthrough" and "Chronic".

At the top of the table there is a label that says "Pain Type/Patient Age" and below that it says "Acute & Recurring". The table also mentions that the market is for adult (18 years) and that it is for 18 years old. The market size is for commercial Oxycodone/Hydrocodone/Medicare Medicare Medicaid Cash Other Opioids and NSAIDS.

Type Generated using AI

We encourage you to view the image in the context of its source document(s) and cite the source(s) when using these images. However, to cite just this image alone, click the “Cite This Image” button and then paste the copied text.


Information copied to your clipboard:

"A table that shows the different types of accessible markets in the United States. The table is divided into four quadrants each representing a diffe...