


Title
Description
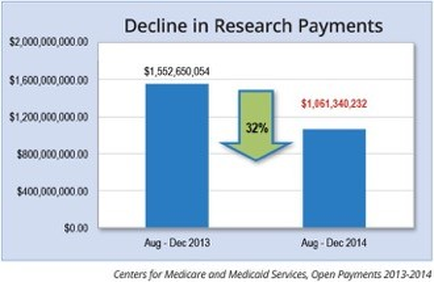
This is a bar graph showing the total Decline in research payments in late 2014 by comparing dollars allocated for August-December 2013 vs. August-December 2014. Research payments declined by 32% in that period from $1552650054 to $1061340232 (per the Centers for Medicare and Medicaid Services). Figures for January-July 2014 are not provided.
Type 
Category
-
Date
2016
Collection
We encourage you to view the image in the context of its source document(s) and cite the source(s) when using these images. However, to cite just this image alone, click the “Cite This Image” button and then paste the copied text.