OIDA Image Collection
Filters:
Reset 
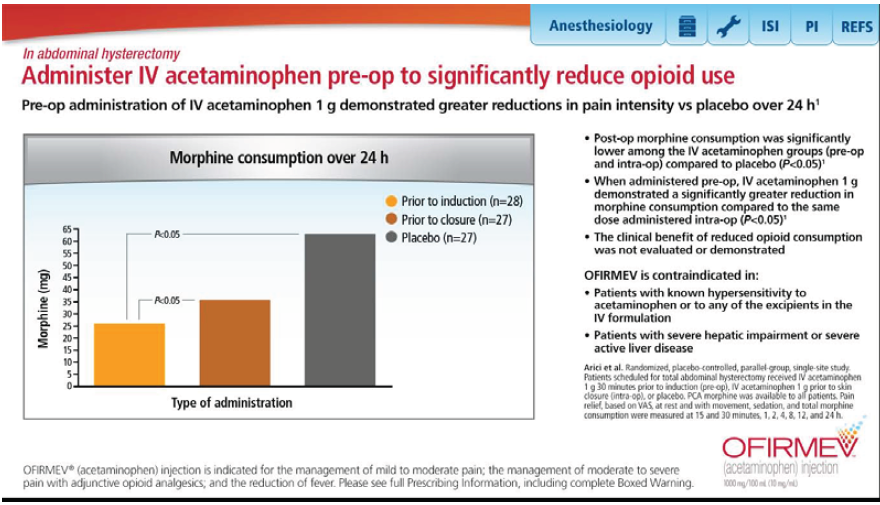
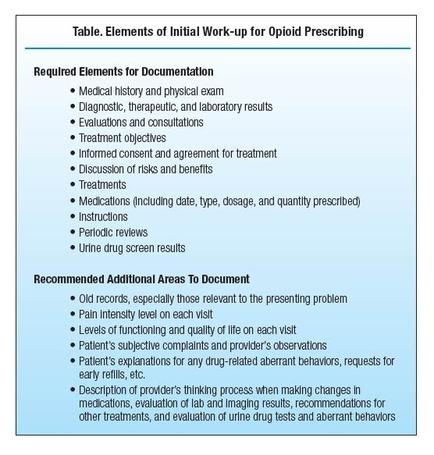
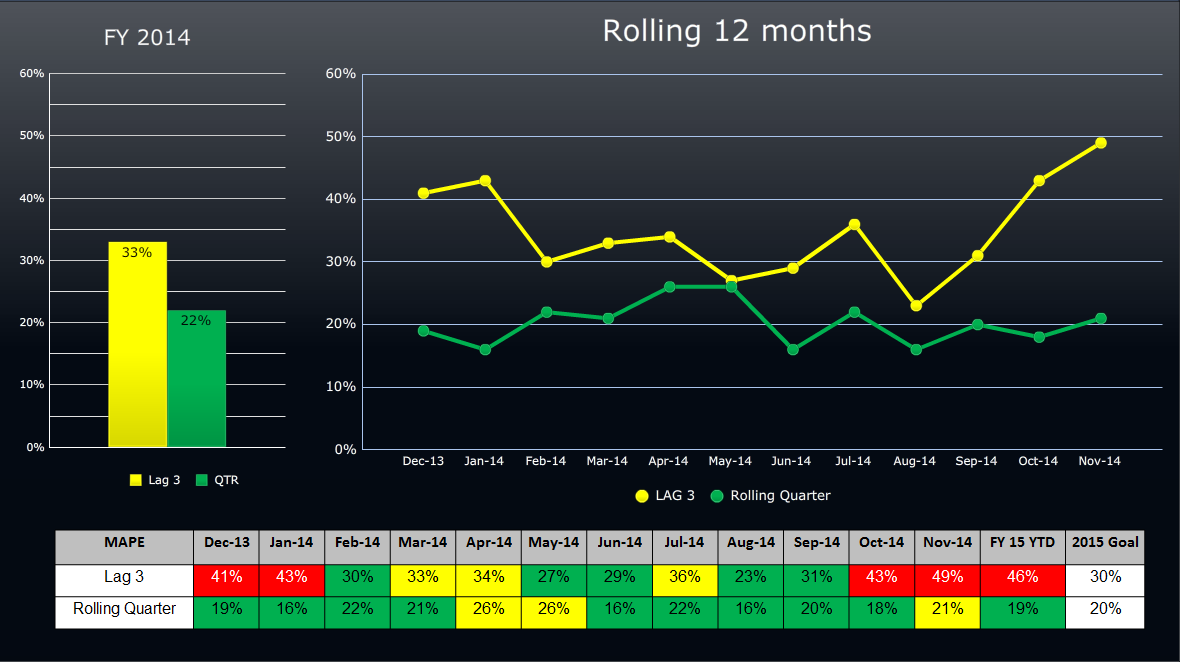
A bar graph that shows the percentage of patients who have been diagnosed with IV acetaminophen pre-op to significantly reduce opioid use. The x-axis of the graph is labeled "Morphine consumption over 24 h" and the y-axis is labeled as "Type of administration". <br /><br />There are two bars in the graph one in orange and the other in gray. The orange bar represents the percentage while the gray bar represents a percentage. The bars are plotted on a horizontal axis with the orange bar representing the percentage and the gray bars representing the percentages.<br /><br />On the right side of the image there is a text that explains that the graph shows that the majority of patients in the image have a positive percentage of the treatment with a higher percentage than the orange bars. The text also mentions that the treatment is not recommended for the management of mild to moderate pain and that the management can be used to reduce the risk of severe pain. The image also includes a logo for OFIRMEV a company that provides information about the treatment.

Description Generated using AI

A bar graph that shows the percentage of patients who have been diagnosed with IV acetaminophen pre-op to significantly reduce opioid use. The x-axis of the graph is labeled "Morphine consumption over 24 h" and the y-axis is labeled as "Type of administration".

There are two bars in the graph one in orange and the other in gray. The orange bar represents the percentage while the gray bar represents a percentage. The bars are plotted on a horizontal axis with the orange bar representing the percentage and the gray bars representing the percentages.

On the right side of the image there is a text that explains that the graph shows that the majority of patients in the image have a positive percentage of the treatment with a higher percentage than the orange bars. The text also mentions that the treatment is not recommended for the management of mild to moderate pain and that the management can be used to reduce the risk of severe pain. The image also includes a logo for OFIRMEV a company that provides information about the treatment.

We encourage you to view the image in the context of its source document(s) and cite the source(s) when using these images. However, to cite just this image alone, click the “Cite This Image” button and then paste the copied text.
Information copied to your clipboard:

"A bar graph that shows the percentage of patients who have been diagnosed with IV acetaminophen pre-op to significantly reduce opioid use. The x-axis...