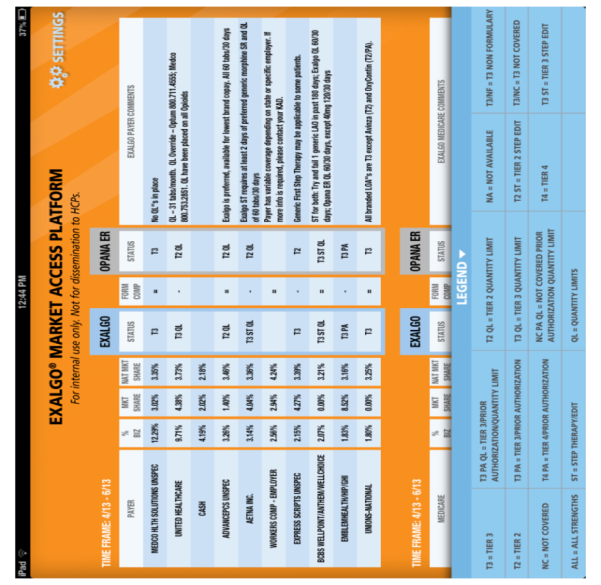
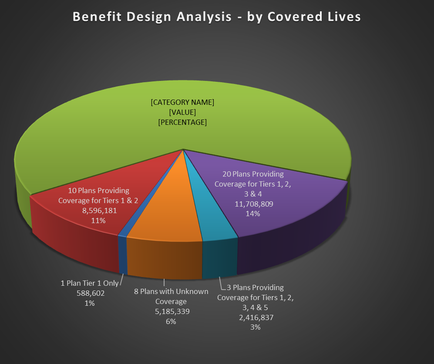
A pie chart that shows the benefit design analysis by covered lives. The chart is divided into six sections each representing a different category. The largest section is green the smallest is red the largest is orange the middle section is purple and the smallest section is pink. The largest section in the chart is labeled "Category Name" and has a value of "Value" in the center. The other three sections are labeled "10 Plans Providing Coverage for Tiers 1 & 2" and "1 Plan Tier 1 Only" with 8 Plans with Unknown Coverage. The smallest section has a percentage of "1" and the largest section has an average of "2 4 5 6 7 8 9 10 11 12 13 14 15 16 17 18 19 20 21 22 23 24 25 26 27 28 29 30 31 32 33 34 35 36 37 38 39 40 41 42 43 44 45 46 47 48 49 50 51 52 53 54 55 56 57 58 59 60 61 62 63 64 65 66 67 68 69 70 71 72 73 74 75 76 77 78 79 80 81 82 83 84 85 86 87 88 89 90 91 92 93 94 95 96 97 98 99 and 97.

Category
-
Date
2015
Collection
We encourage you to view the image in the context of its source document(s) and cite the source(s) when using these images. However, to cite just this image alone, click the “Cite This Image” button and then paste the copied text.