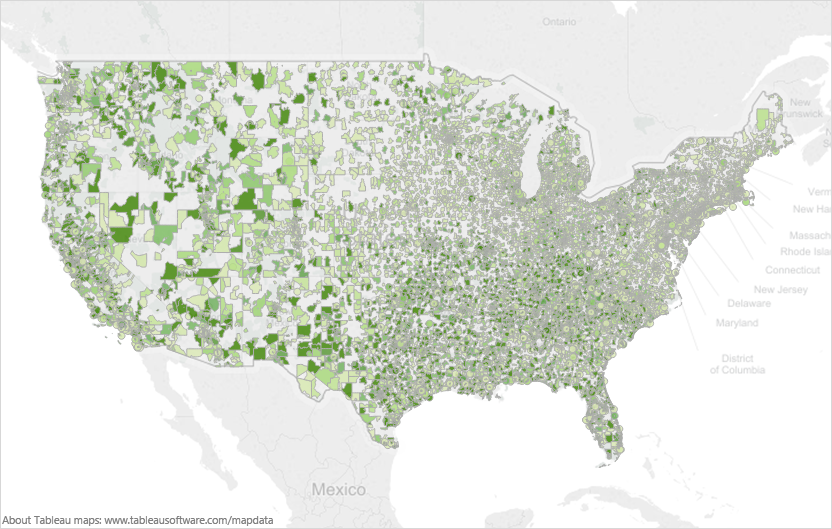
A map of the United States of America. It shows the borders of each county. Each county is filled in with different shades on a gradient from white to green. There is no key indicating what the shades mean. A footer on the map indicates that the graphic was created in Tableau.
Description 
Type
Category
Source 1 of 23
-
Date
2015
Collection
-
Date
2015
Collection
-
Date
2015
Collection
-
Date
2015
Collection
-
Date
2017
Collection
-
Date
2015
Collection
-
Date
2015
Collection
-
Date
2015
Collection
-
Date
2015
Collection
-
Date
2016
Collection
-
Date
2015
Collection
-
Date
2015
Collection
-
Date
2015
Collection
-
Date
2015
Collection
-
Date
2016
Collection
-
Date
2017
Collection
-
Date
2015
Collection
-
Date
2015
Collection
-
Date
2016
Collection
-
Date
2015
Collection
-
Date
2015
Collection
-
Date
2015
Collection
-
Date
2015
Collection
We encourage you to view the image in the context of its source document(s) and cite the source(s) when using these images. However, to cite just this image alone, click the “Cite This Image” button and then paste the copied text.