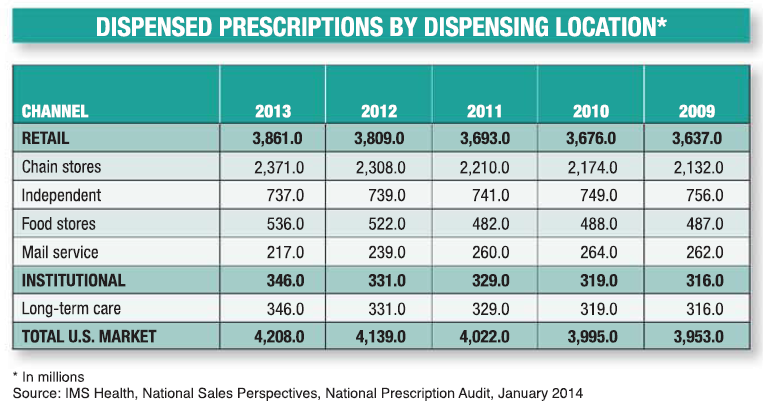
A table that shows the dispensed prescriptions by dispensing location in the United States from January 2014 to January 2014. The table is titled "Dispensed Prescriptions by Dispensing Location" and has three columns. The first column lists the channel retail chain stores independent food stores mail service institutional long-term care and total U.S. market. The second column shows the number of dispenses in each channel. The third column shows that the channel has 3861.0 the chain stores have 2371.0 and the independent food store has 737.0. The total US market has 4208.0 dispenses.
The table also has a legend at the bottom that explains the meaning of each column. The background of the table is white and the text is black.
Category
Source 1 of 15
-
Date
2014
Collection
-
Date
2014
Collection
-
Date
2014
Collection
-
Date
2014
Collection
-
Date
2014
Collection
-
Date
2014
Collection
-
Date
2014
Collection
-
Date
2014
Collection
-
Date
2014
Collection
-
Date
2014
Collection
-
Date
2014
Collection
-
Date
2013
Collection
-
Date
2014
Collection
-
Date
2014
Collection
-
Date
2014
Collection
We encourage you to view the image in the context of its source document(s) and cite the source(s) when using these images. However, to cite just this image alone, click the “Cite This Image” button and then paste the copied text.

