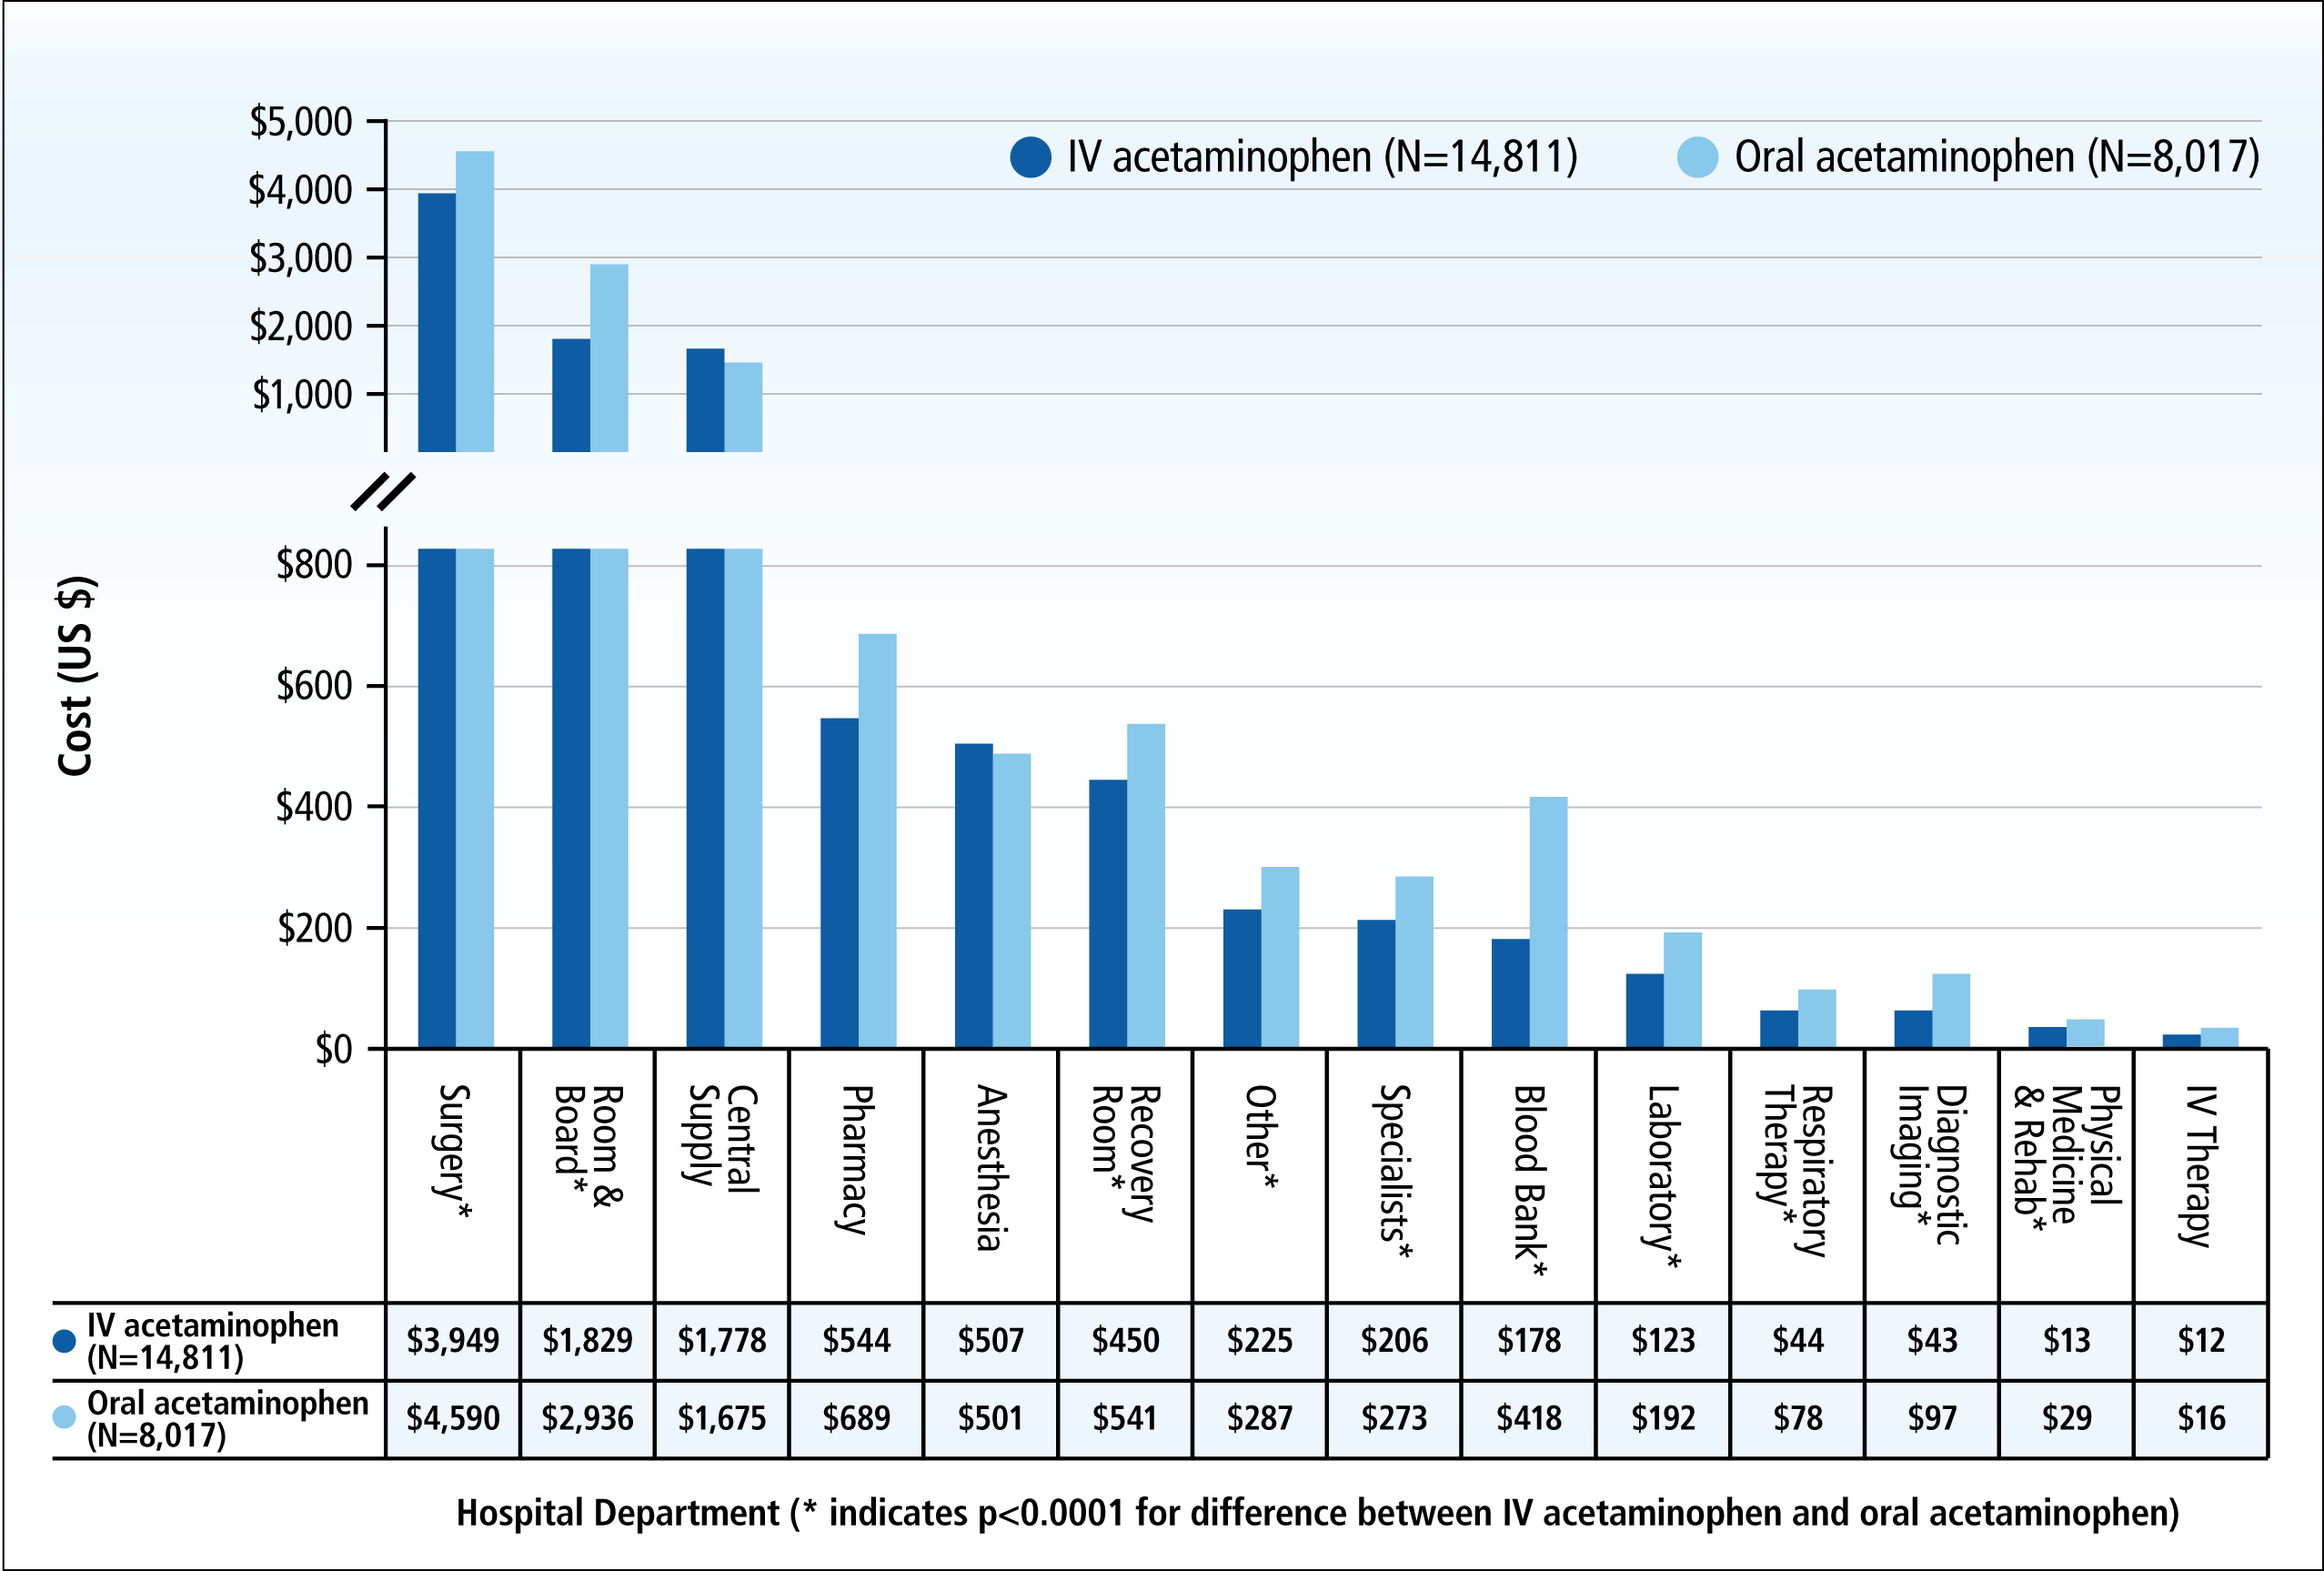
A bar graph that compares the average cost of IV acetaminophen (N=14811) and Oral acetaminophen (N-8817) across various hospital departments and medical contexts. The y-axis represents cost as measured in United States dollars from $0 to $5000. The x-axis lists Surgery Room & Board Central Supply Pharmacy Anesthesia Recovery Room Other Specialists Blood Bank Laboratory Respiratory Therapy Diagnostic Imaging Physical Medicine & Rehab and IV Therapy. The data shows that Surgery incurs the highest average cost for both IV acetaminophen ($3949) and Oral acetaminophen ($4590) and IV Therapy incurs the lowest average cost for both IV acetaminophen ($12) and Oral acetaminophen ($16). The background is white and gray with graphic elements in dark blue and light blue and text in black.

Description
Category
Source 1 of 10
-
Date
2017
Collection
-
Date
2017
Collection
-
Date
2017
Collection
-
Date
2017
Collection
-
Date
2017
Collection
-
Date
2017
Collection
-
Date
2017
Collection
-
Date
2016
Collection
-
Date
2017
Collection
-
Date
2017
Collection
We encourage you to view the image in the context of its source document(s) and cite the source(s) when using these images. However, to cite just this image alone, click the “Cite This Image” button and then paste the copied text.


