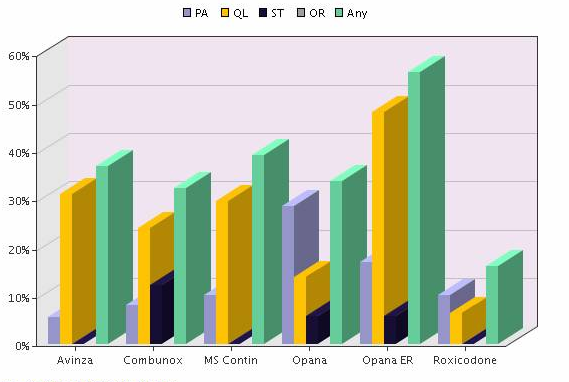
An untitled bar graph. On the x-axis there are a number of drug names including Avinza Combunox MS Contin Opana Opana ER and Roxicodone. The y-axis has a range of percentages between 0% and 60%. For each of the drug names there is a column in different colors. A key indicates that the different colors each represent one of the following: "PA" "QL" "ST" "OR" and "Any".
Category
Source 1 of 8
-
Date
2007
Collection
-
Date
2007
Collection
-
Date
2008
Collection
-
Date
2007
Collection
-
Date
2007
Collection
-
Date
2007
Collection
-
Date
2007
Collection
-
Date
2007
Collection
We encourage you to view the image in the context of its source document(s) and cite the source(s) when using these images. However, to cite just this image alone, click the “Cite This Image” button and then paste the copied text.

