Title
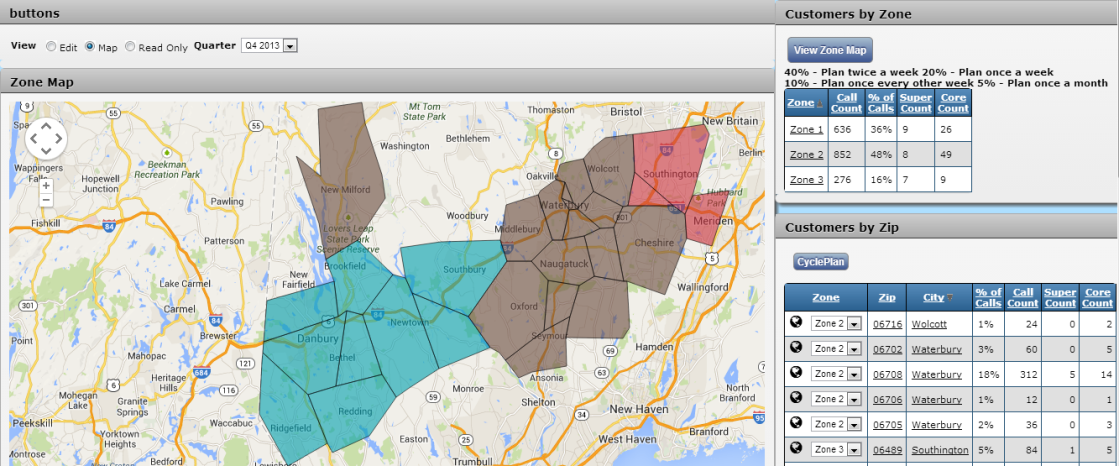
A screenshot of a map of a city with different colors representing different zones. The map is divided into different sections each with a different color representing a different area. The colors range from light blue to dark blue with some areas being darker blue and others being lighter blue.
On the top right corner of the image there is a table that shows the number of customers by zone in each area. On the top left corner there are buttons for the user to navigate through the map such as "View" "Edit" "View" and "Help". On the bottom right corner the user can click on the "Customers by Zone" button to view the map and select the desired zone. The table also has a list of options for customers to choose from including "Zones by Zip" "Customer by Zip" and a dropdown menu for selecting the type of zone they want to use.
Category
Source 1 of 5
-
Date
2014
Collection
-
Date
2014
Collection
-
Date
2014
Collection
-
Date
2014
Collection
-
Date
2014
Collection
We encourage you to view the image in the context of its source document(s) and cite the source(s) when using these images. However, to cite just this image alone, click the “Cite This Image” button and then paste the copied text.
