Title
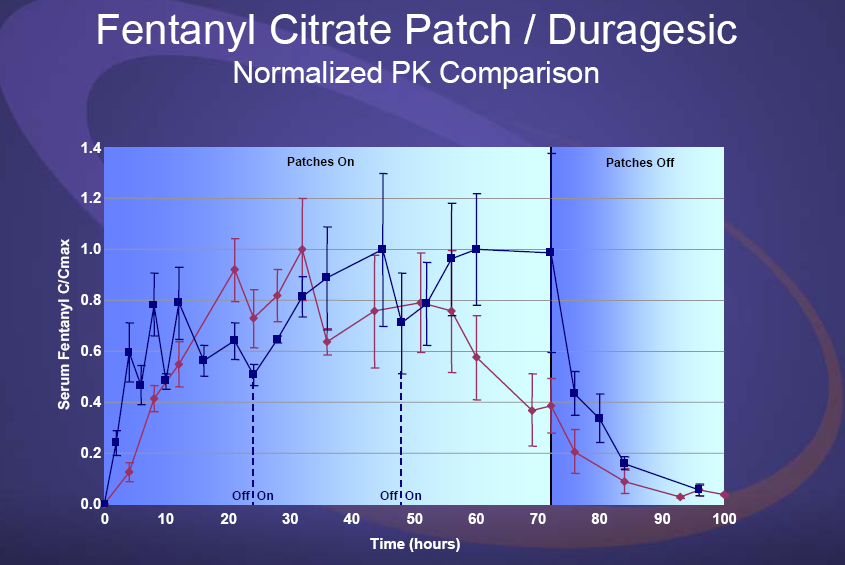
A run chart with the title "Fentanyl citrate patch / Duragesic : normalized PK comparison". The x-axis of the graph is labeled Time (from 0 to 100 hours in 10 hour increments) and the y-axis is labeled Serum Fentanyl C/Cmax (from 0.0 to 1.4 in 0.2 increments). The patches were on for the first 70 hours and off for the last 30 hours. There are lines and data points in both red and blue. The background is various shades of blue and red with text in white and blue.
Category
-
Date
2008
Collection
We encourage you to view the image in the context of its source document(s) and cite the source(s) when using these images. However, to cite just this image alone, click the “Cite This Image” button and then paste the copied text.


