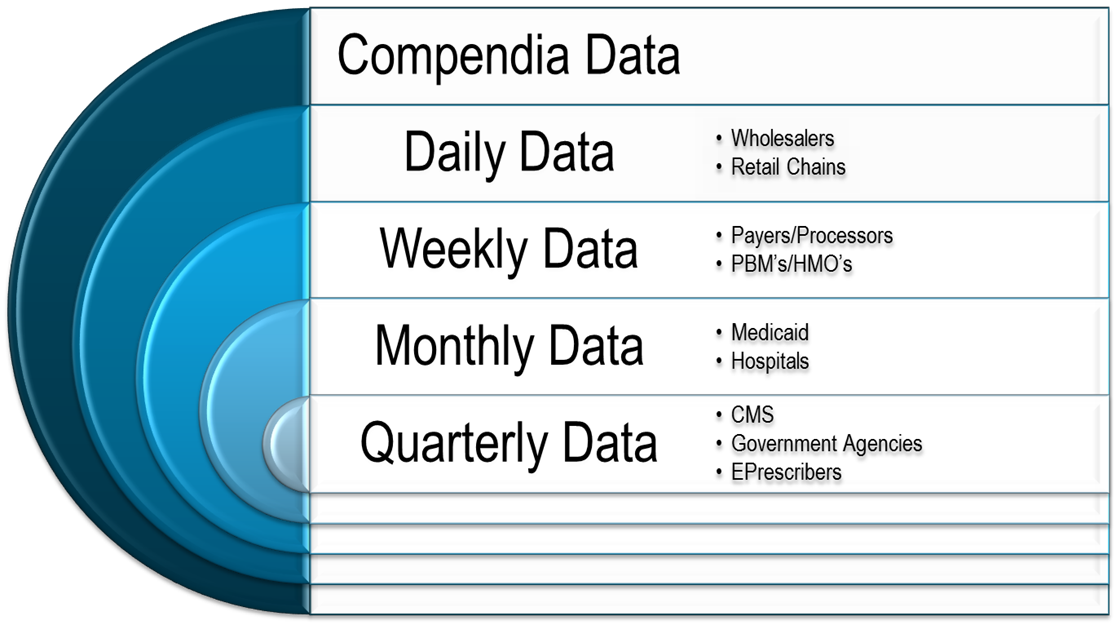
A table that shows the different types of compendium data. The table is divided into three sections - Compendium Data Daily Data Weekly Data Monthly Data and Quarterly Data.
The first section is labeled "Compendium Data" and has a blue circle on the left side. The second section is titled "Daily Data" with a white background. The third section has a list of different categories such as "Wholesalers" "Retail Chains" "Payers/Processors" "PMM/HMO's" "Medicaid Hospitals" "CMS" "Government Agencies" and "Eprescribers". The fourth section has the same categories as the first section but with a different color scheme.
Overall the table is a visual representation of the compendium of data which is a type of data that is used to store and analyze data in a specific manner.
Category
Source 1 of 7
-
Date
2013
Collection
-
Date
2013
Collection
-
Date
2013
Collection
-
Date
2013
Collection
-
Date
2013
Collection
-
Date
2013
Collection
-
Date
None
Collection
We encourage you to view the image in the context of its source document(s) and cite the source(s) when using these images. However, to cite just this image alone, click the “Cite This Image” button and then paste the copied text.


