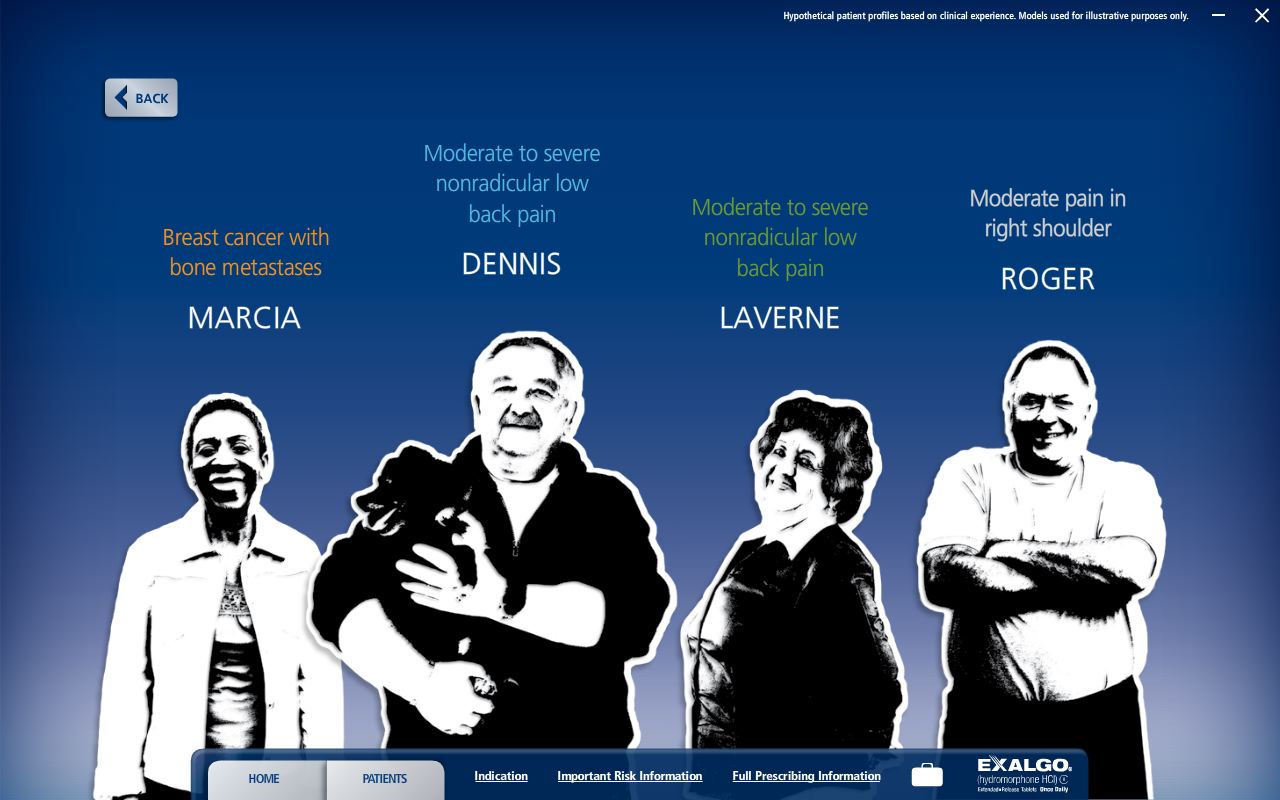
An advertisement for Exalgo. The title reads "Conversion may help Eva Obtain Therapeutic value with once-daily Exalgo". At the center of the page there is an illustration of a woman with long dark hair and a blue background. She is smiling and looking directly at the camera.
On the left side of the page there is a medical history and pain rating for an example patient named Eva. There is text that reads "Once-daily EXALGO (hydromorphone HCI) Extended-Release Tablets with a stable and consistent plasma concentration may help patients like Eva." There is a line chart showing that EXALGO remained over 50% of C for more than 90% of the dosing interval.
On the right side of the page there is a header reading "When converting from IR hydrocodone EXALGO may be a logical next step due to its metabolism." There are two line charts showing the hydrocodone and hydromorphone plasma levels following a 10 mg dose of hydrocodone. Below the graphs it shows the next steps for converting Eva to Exalgo which include "Calculate" "Adjust" and "Titrate". There is also important risk information.
At the bottom right of the infographic there is the Exalgo logo.

Description
Type
Category
Source 1 of 11
-
Date
2012
Collection
-
Date
2012
Collection
-
Date
2011
Collection
-
Date
2012
Collection
-
Date
2012
Collection
-
Date
2011
Collection
-
Date
2011
Collection
-
Date
2012
Collection
-
Date
2012
Collection
-
Date
2012
Collection
-
Date
2011
Collection
We encourage you to view the image in the context of its source document(s) and cite the source(s) when using these images. However, to cite just this image alone, click the “Cite This Image” button and then paste the copied text.


