OIDA Image Collection
Filters:
Reset 
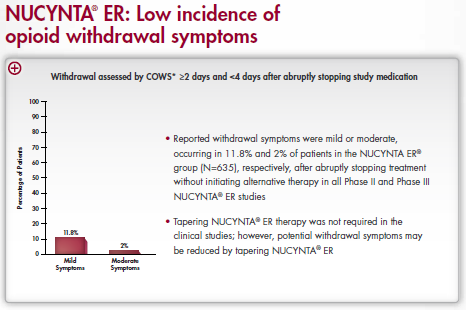
A slide from a presentation about NUCYNTA ER (Low incidence of opioid withdrawal symptoms). The slide has a title at the top that reads "NUCYNTA ER: Low incidence of opioids withdrawal symptoms". Below the title there is a table with three columns. The first column is labeled "Withdrawal assessed by COWS" and the second column is titled "22 days and 4 days after abruptly stopping study medication". <br /><br />The first column has a bar graph that shows the percentage of patients who have been diagnosed with opioid withdrawal. The x-axis of the graph represents the number of patients while the y-axis represents the percentage. The graph shows that the majority of patients were mild or moderate occurring in 11.8% and 2% of the patients in the NUCYCYNA ER group (N=6.3%) respectively after abruptly stopped treatment without initiating alternative therapy in all Phase II and Phase III.<br /><br />There is also a red bar graph on the left side of the slide that shows a decrease in the percentage indicating that the percentage was not required in the clinical studies however potential withdrawal symptoms may be reduced by topping NUCYNIA ER.

Description Generated using AI

A slide from a presentation about NUCYNTA ER (Low incidence of opioid withdrawal symptoms). The slide has a title at the top that reads "NUCYNTA ER: Low incidence of opioids withdrawal symptoms". Below the title there is a table with three columns. The first column is labeled "Withdrawal assessed by COWS" and the second column is titled "22 days and 4 days after abruptly stopping study medication".

The first column has a bar graph that shows the percentage of patients who have been diagnosed with opioid withdrawal. The x-axis of the graph represents the number of patients while the y-axis represents the percentage. The graph shows that the majority of patients were mild or moderate occurring in 11.8% and 2% of the patients in the NUCYCYNA ER group (N=6.3%) respectively after abruptly stopped treatment without initiating alternative therapy in all Phase II and Phase III.

There is also a red bar graph on the left side of the slide that shows a decrease in the percentage indicating that the percentage was not required in the clinical studies however potential withdrawal symptoms may be reduced by topping NUCYNIA ER.

We encourage you to view the image in the context of its source document(s) and cite the source(s) when using these images. However, to cite just this image alone, click the “Cite This Image” button and then paste the copied text.
Information copied to your clipboard:

"A slide from a presentation about NUCYNTA ER (Low incidence of opioid withdrawal symptoms). The slide has a title at the top that reads "NUCYNTA...