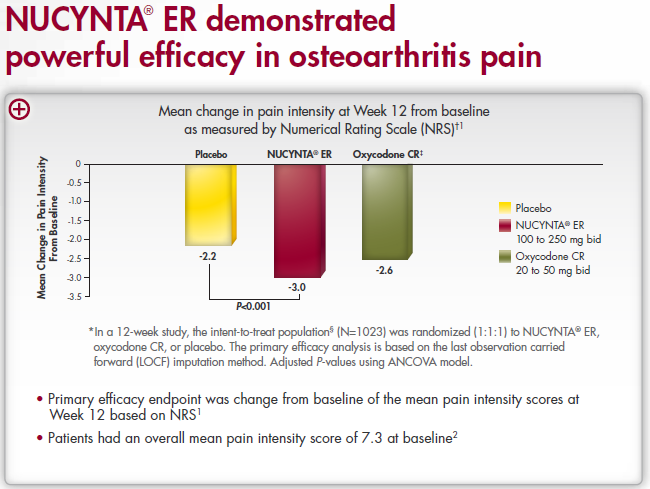
A bar graph titled "NUCYNTA ER demonstrated powerful efficacy in osteoarthritis pain. The subtitle is "Mean change in pain intensity at Week 12 from baseline as measured by Numerical Rating Scale (NRS)." The x-axis of the graph has sections for a placebo NUCYNTA ER and Oxycodone CR. The y-axis is labeled as "Mean change in Pain intensity from baseline" with values between 0 and -3.5. The graph shows that the placebo has a value of -2.2 NUCYNTA ER has a value of -3.0 and Oxycodone CR has a value of -2.6.
Text below the graph indicates that the primary efficacy endpoint was change from baseline of the mean pain intensity scores at Week 12 based on NRS and that the majority of patients had an overall mean pain intensity score of 7.3 at baseline.
Description
Category
-
Date
2010
Collection
We encourage you to view the image in the context of its source document(s) and cite the source(s) when using these images. However, to cite just this image alone, click the “Cite This Image” button and then paste the copied text.

