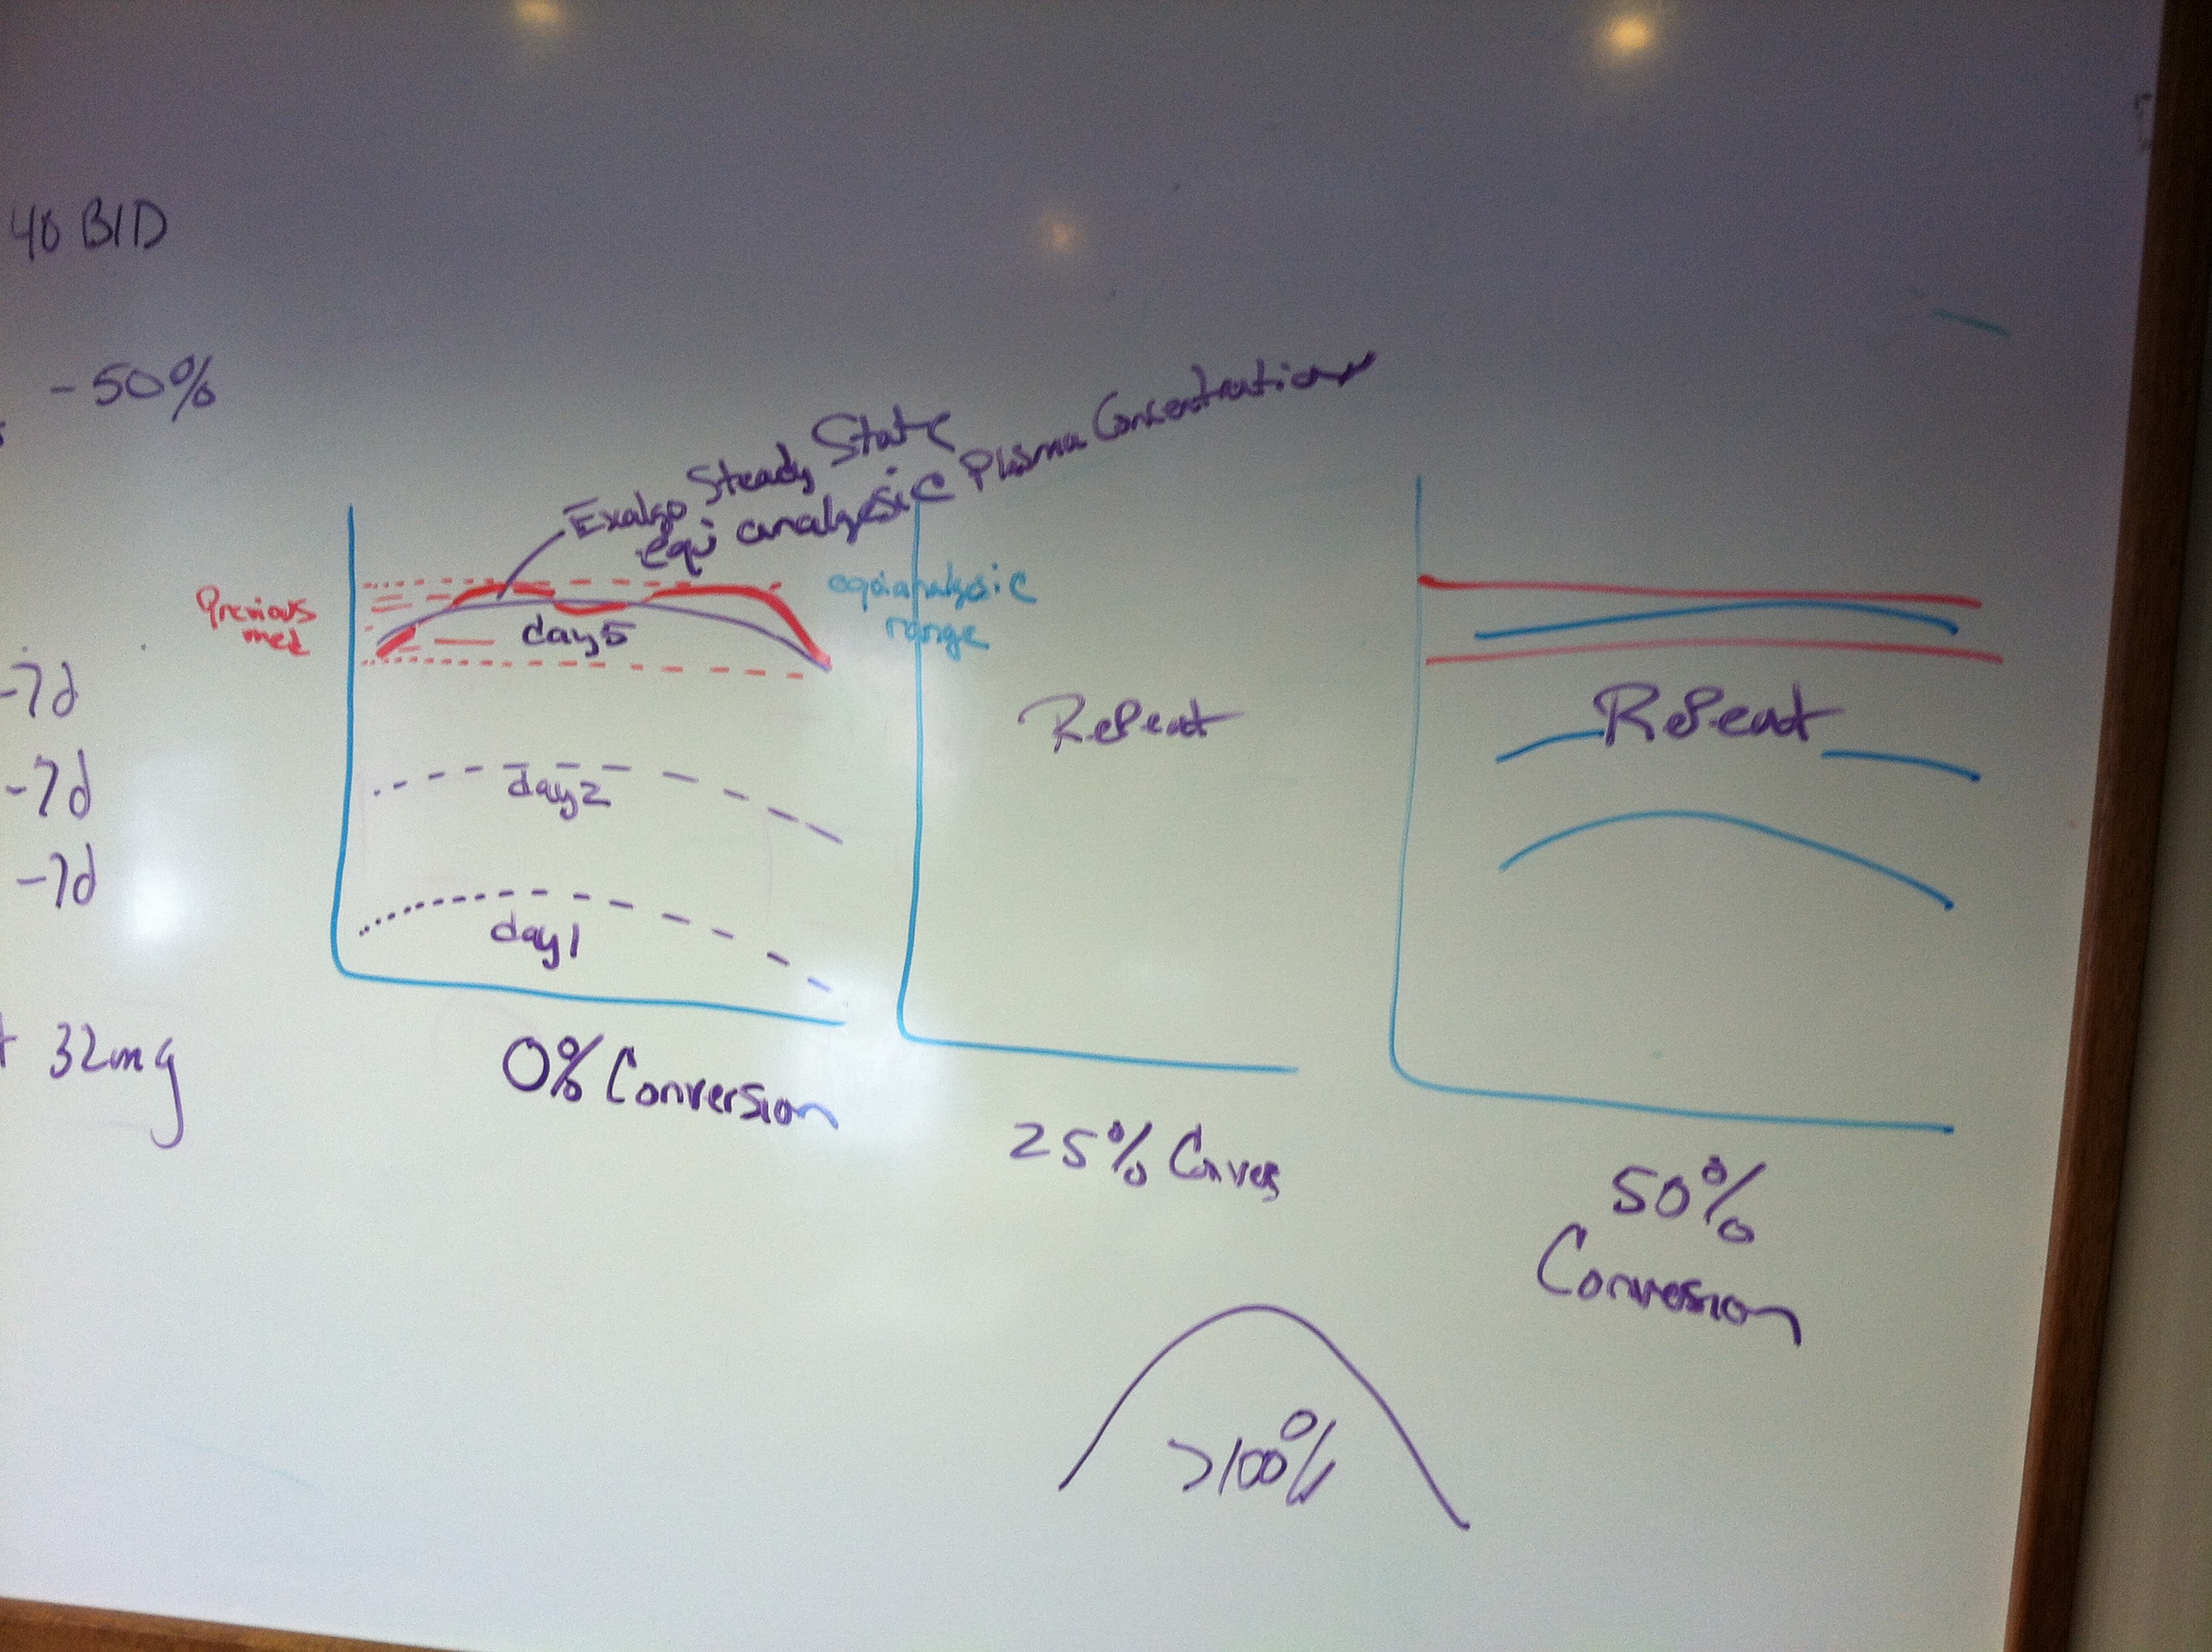
A whiteboard with a flowchart drawn on it. The flowchart is divided into three sections.
The first section is labeled "40 BID" and has a red arrow pointing to the left side of the board. The second section is titled "50% Conversion" and shows a line graph with a blue arrow pointing towards the right side. The graph shows that the conversion rate of a product or service is 0% conversion. The third section is labeled "Reset" and is represented by a red line.
There are also two lines drawn on the whiteboard one labeled "0%" and the other labeled "2% Conversion". The red line represents the percentage of conversion while the blue line represents a percentage conversion. There is also a purple line representing the percentage conversion which is 100%.
Overall the flowchart appears to be a visual representation of a business process or strategy.
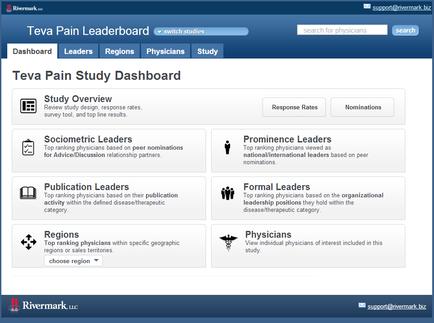
Category
-
Date
2012
Collection
We encourage you to view the image in the context of its source document(s) and cite the source(s) when using these images. However, to cite just this image alone, click the “Cite This Image” button and then paste the copied text.
